
Data Template Visualization
Albert's powerful visualization feature lets you visualize how a particular Data Template is used along with other Data Templates Albert's powerful visualization feature lets you visualize how data is collected by combining different SOPs to test material properties. Data Templates are the final outputs of property tasks.
Albert's visualization feature lets you see Tasks performed by users who have used different Parameter Groups and Data Templates along with the selected Property Parameter Group. This gives you an overview on how different Parameter Groups and Data Templates can be used for performing Property Tasks.
Data Template Visualization
To visualize the usage of a particular Data Template, navigate to the desired Data Template. For more information on searching and filtering Data Templates, navigate to this help article.
Once you've opened the Data Template, scroll down to the "Usage Data" section of the page.
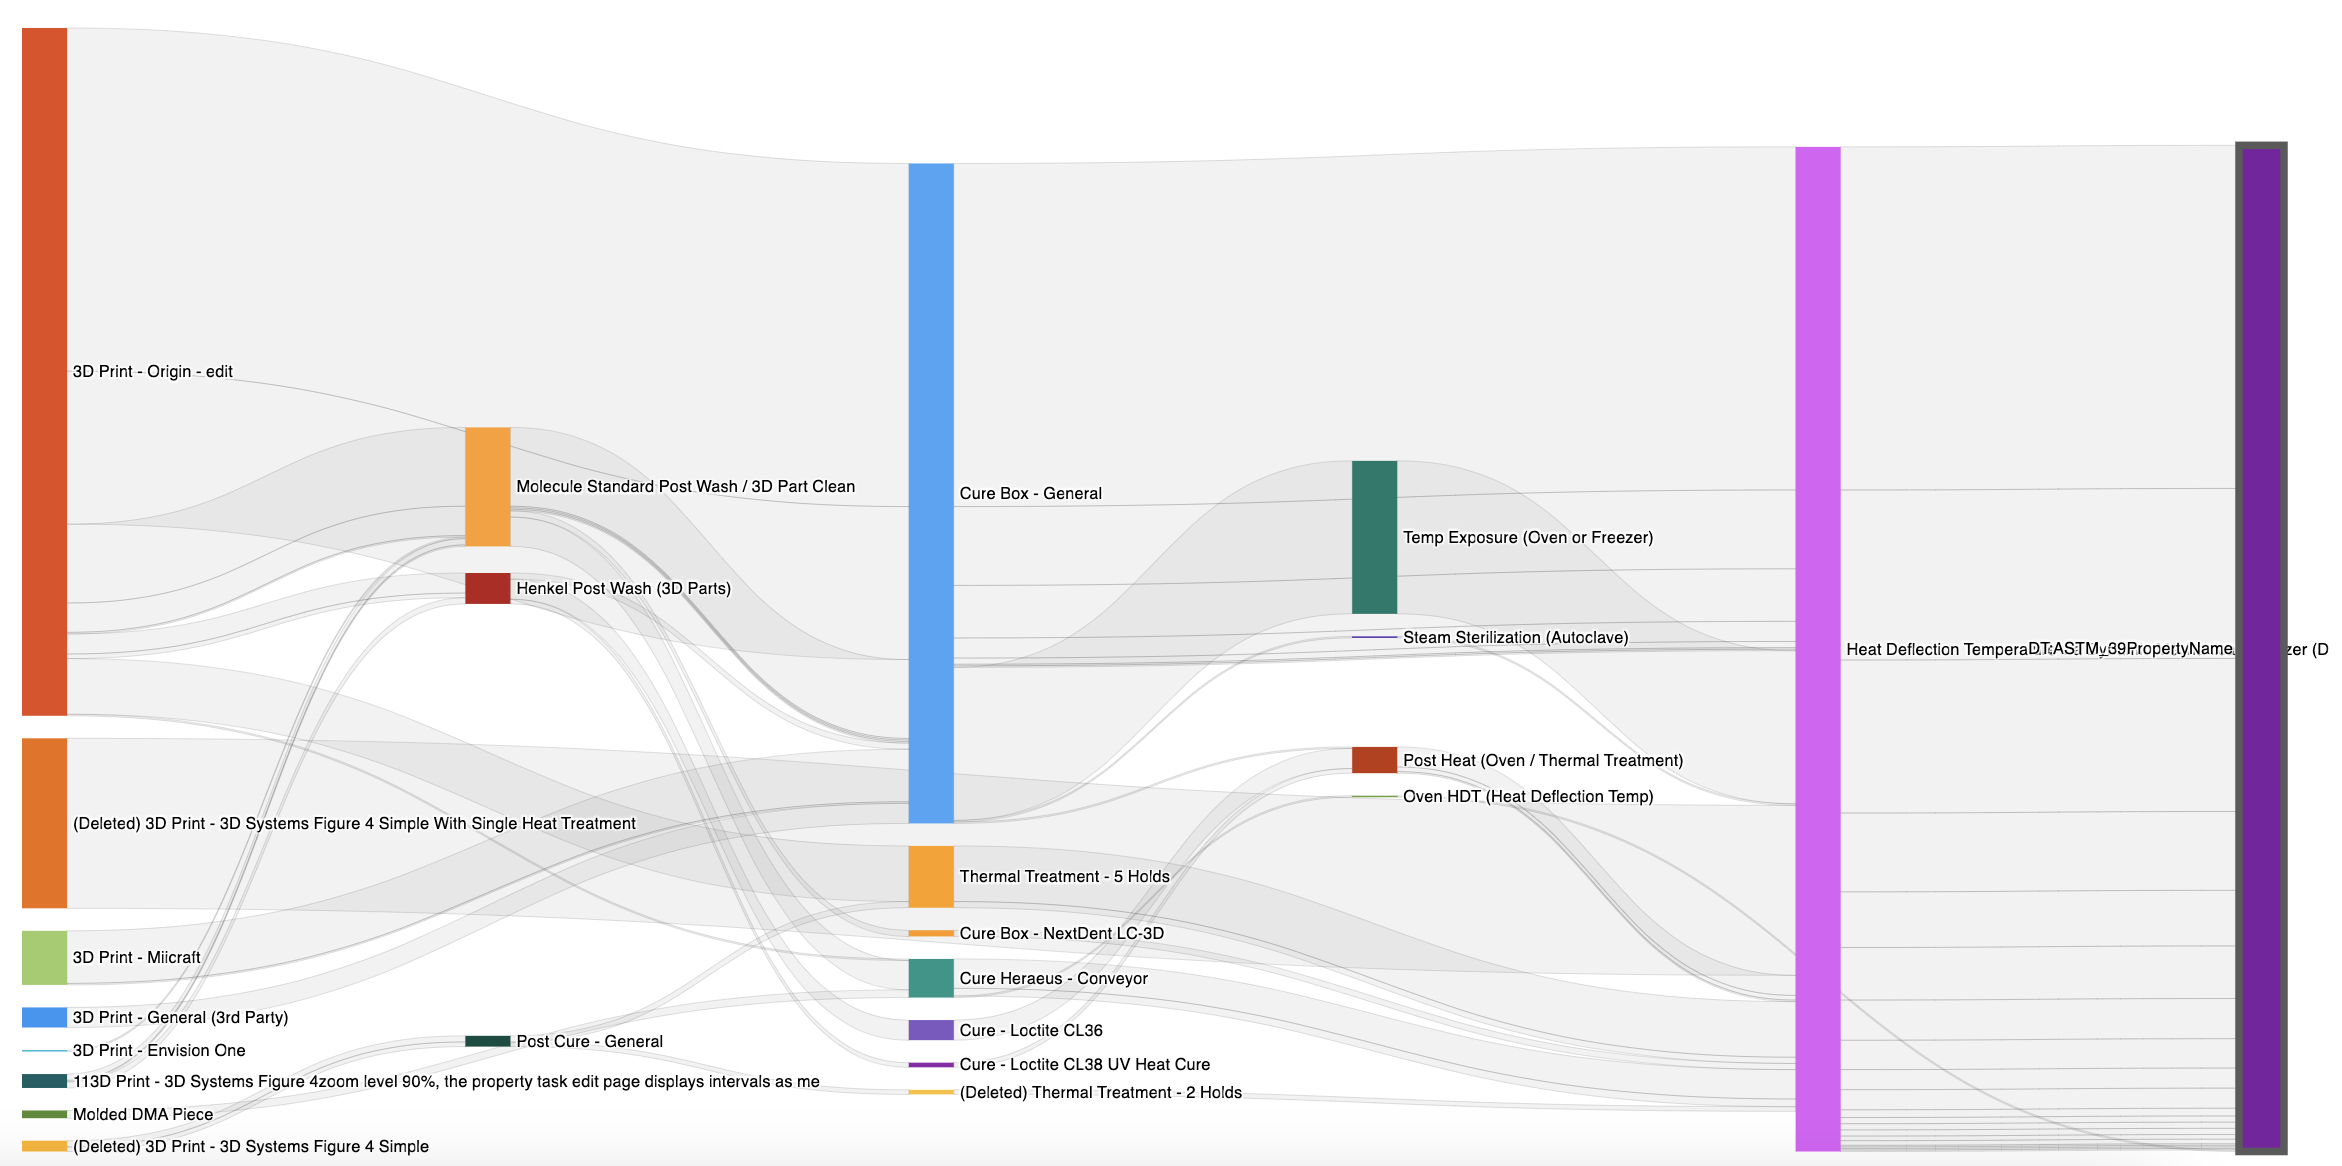
When the selected Data Template is used for many Property Tasks, along with other Parameter Groups and Data Templates, Albert will display the entire visualization.
Note: If the Parameter Group has never been used for a Property Task, the visualization section will be blank.
Editing the Parameter Group Visualization
This plot will display all of the process workflows that have ever been used with the Data Template you are viewing. If you would like to simplify the plot, there are a number of filter options to down select the data:
Filter by Task Owner or Creator
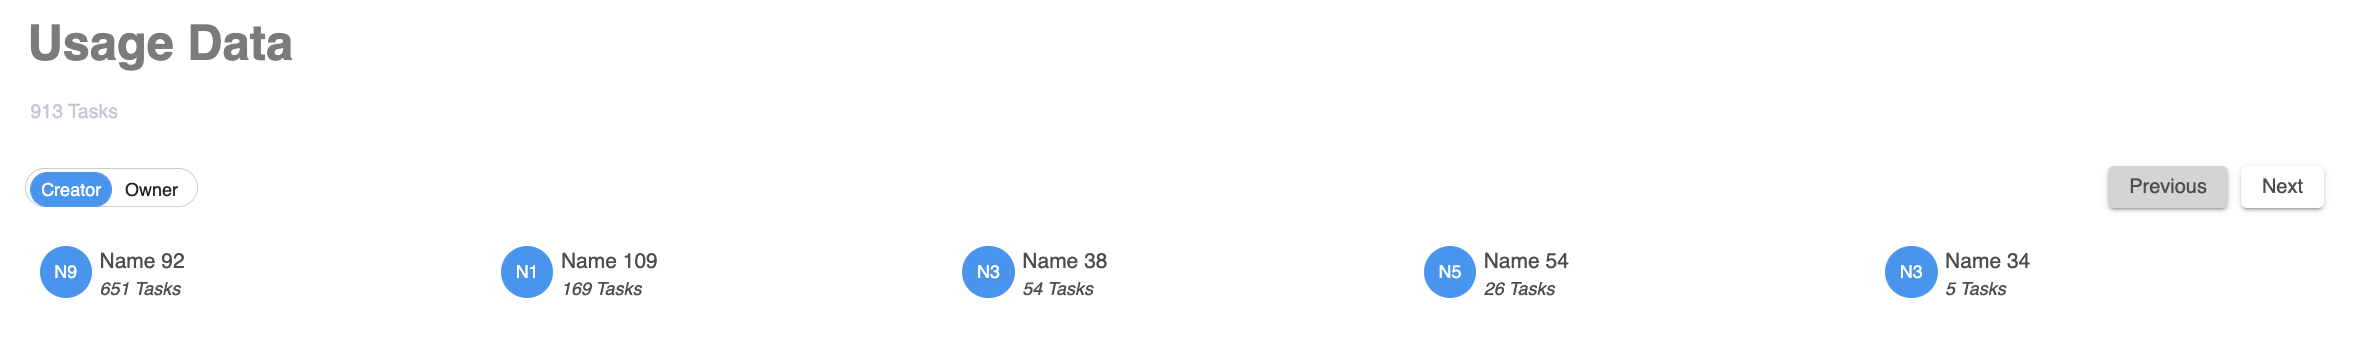
Under the Usage Data section, usage can be filtered by toggling the pill-shaped Creator and Owner options in this section. With "Creator" selected, you will see the names of colleagues and the number of Tasks created by each colleague. With "Owner" selected, you will see the names of colleagues and the number of Tasks performed by each colleague. Click on the name of a colleague to visualize data associated only with their Tasks, and you'll notice the visualization change accordingly.
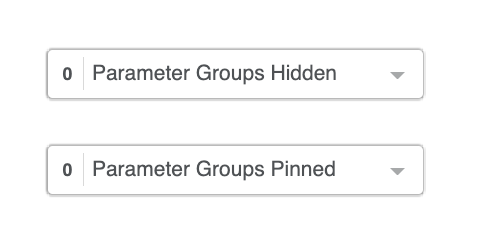
Hiding and/or Pinning Parameter Groups
When you don't want certain Parameter Groups or Data Templates be part of the visualization, you can hide them by selecting the "Parameter Groups Hidden" dropdown and typing in the Parameter Groups you'd like to hide.
When you want certain Parameter Groups and Data Templates to be part of your visualization, you can pin them by selecting the "Parameter Groups Pinned" dropdown and typing in the Parameter Groups you'd like to include.
Visualizing Historical Data Templates used in Property Tasks
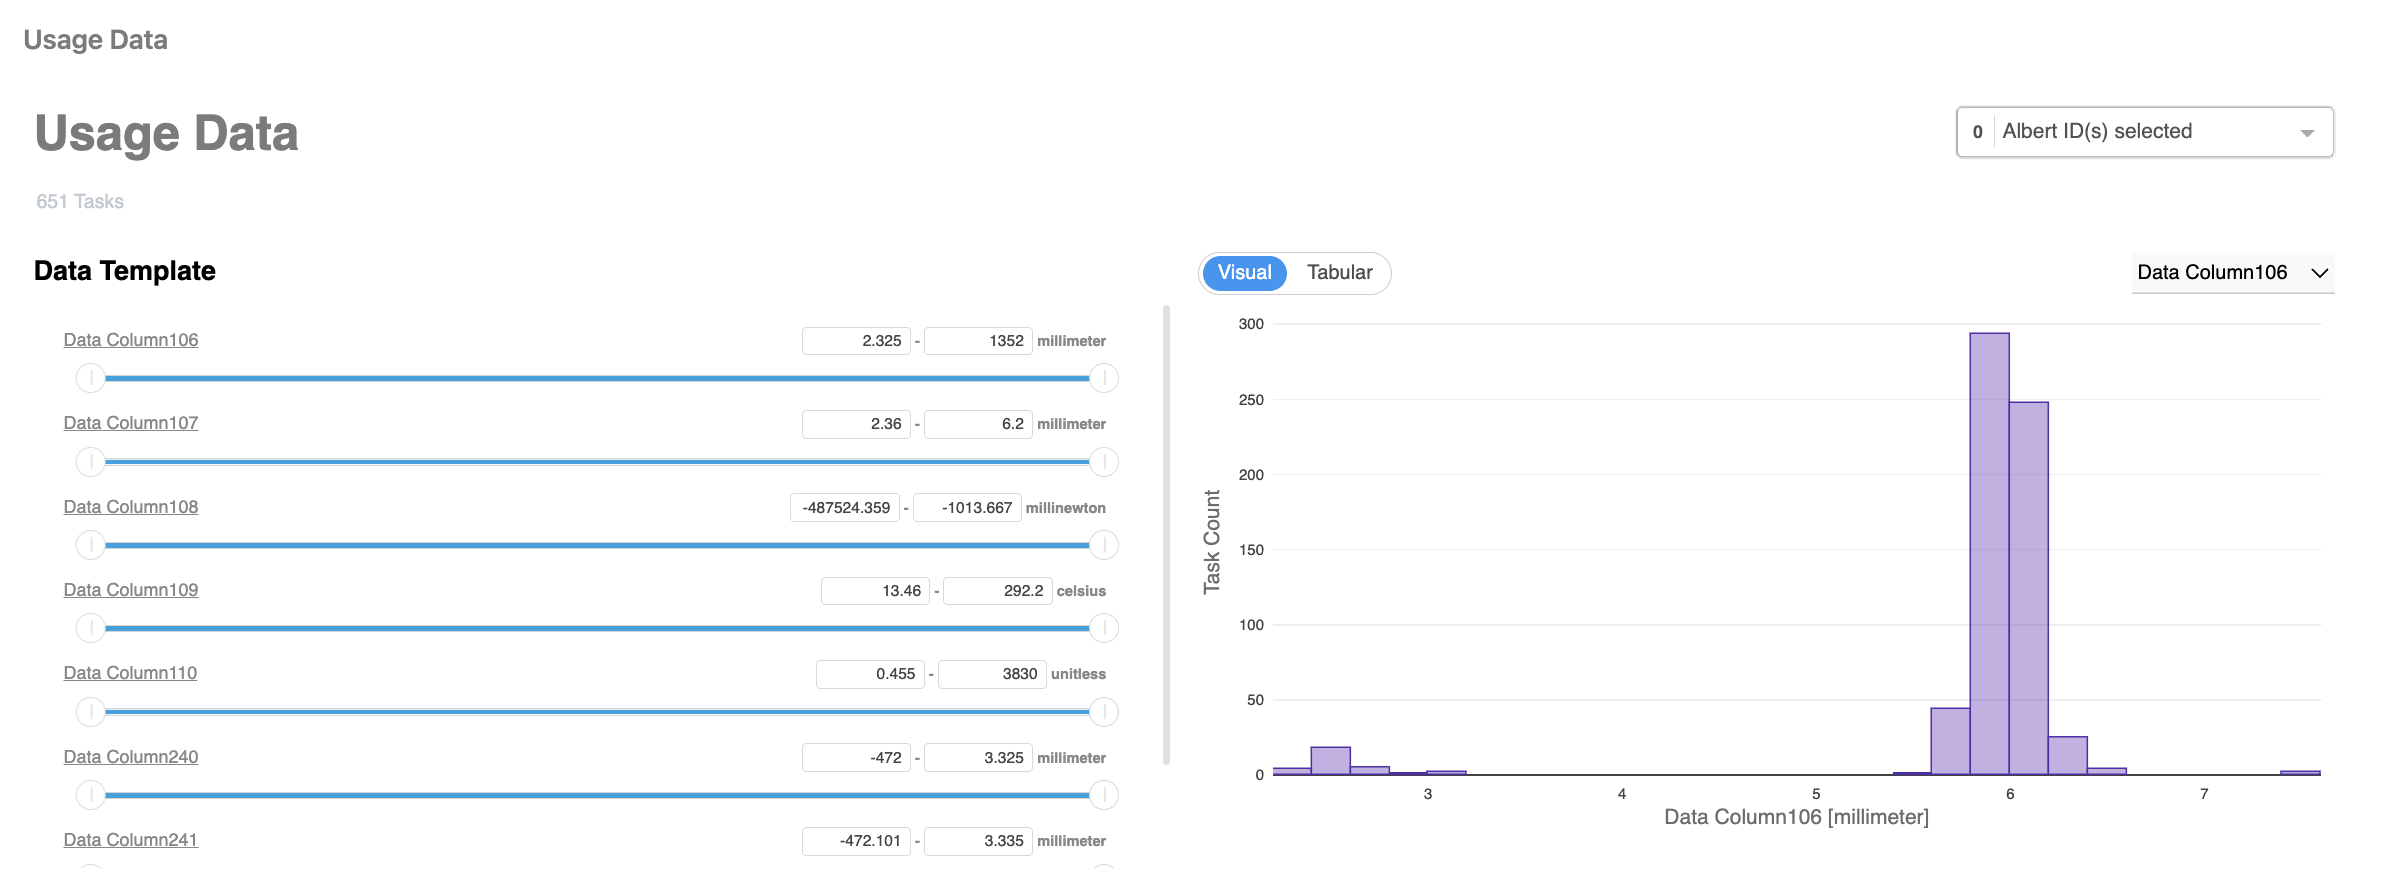
The right section of the page shows a histogram while the left section shows sliders with all the parameters contained in the Data Template.

Histogram
For the Histogram, the X-axis is the parameter and Y-axis is the task count of the property data collected. The X-axis can be changed to a different parameter using the drop down menu at the top right corner of the histogram plot.
All of the tasks associated with the data collection can be viewed by toggling between the visual and tabular setting (found in the upper left hand corner of the histogram). The tabular data shows you Task ID, Albert ID, Batch Lot, and Parameter selected. Clicking on the Task ID will take you the Property Task.
Slider
The slider function in a Data Template can be used to search for a parameter of interest.
When one parameter is selected and narrowed, all the other parameters are adjusted so the data collected in the search criteria can be properly shown (the property parameters are linked with each other in a Data Template). The data of interest can be filtered using the sliders by dragging the round button to left or right or by typing in your desired range.
