
Data Templates Overview
Data Templates define how results are captured and structured in Albert. This article explains what Data Templates are, when to use them, how to create and configure them (including units and validation), how to connect them to scripts for automation, and best practices and troubleshooting tips.
Overview: What Data Templates Are & When to Use Them
Data Templates are structured layouts that define which results and (optionally) parameters are captured for a given type of experiment or test. They represent the standardized output of an experiment in Albert.
What Data Templates help with
Consistent results
Capture data in the same way across runs, teams, and locations.Reusable structures
Turn frequent tests into templates you can apply again and again.Structured entries
Use units and validation rules so data stays clean and comparable.Less manual work
Automate data capture with scripts instead of copy-and-paste.
Use Data Templates when…
You repeatedly run the same type of experiment and want consistent, comparable results.
Your test follows a standard method (e.g., ASTM, ISO) and the output must match that structure.
Multiple colleagues or sites need to compare results across runs or locations.
You want to automate data entry from instruments or files into Property Tasks.
Typically, only certain users—such as an Albert Champion or Albert Administrator—can create or edit Data Templates. If you need a new template or changes to an existing one, contact one of these users.
Creating Data Templates
Start from the Global Create button, give your template a clear name and description, and select the first set of results you want to capture.
Define the basics
Use a specific name including property, conditions, and method (e.g. “Viscosity – 25°C – ASTM D445”).
Add a short description explaining when and why the template is used.
Connect to standards & results
Link to ASTM, ISO, or internal methods via the Organization / Standard field.
Select or create the result columns you want in the template output.
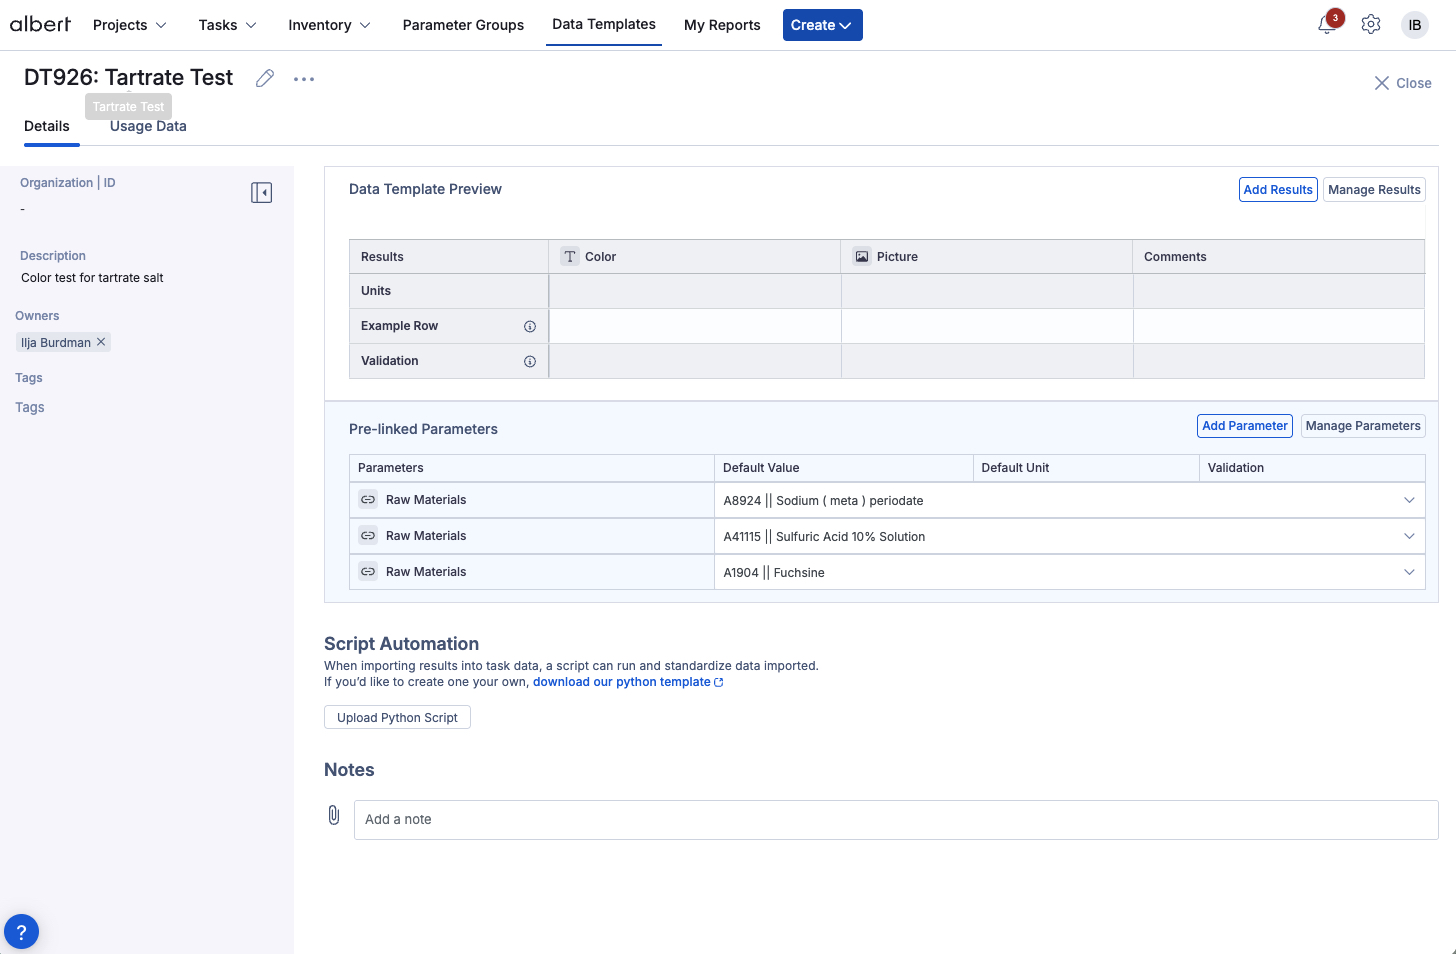
Create a Data Template
Click the Global Create button at the top of your Albert screen.
In the modal, choose Data Template.
Fill in the name, description, and (optionally) Organization / Standard.
Under Results, search and select existing result definitions, or type to create new result columns.
Click Create. The template opens so you can configure the details.
💡 Tip: If a similar template already exists, duplicate it and adjust name, description, and results instead of starting from scratch.
Configuring Results, Units, Data Types & Validation
After creating your Data Template, refine each result column with units and data types so entries are consistent, readable, and ready for analysis.
Units
Set a unit for each result (e.g. wt%, °C, Pa·s).
Units appear in the column header and keep interpretation consistent.
Data types
T Text for free-form entries.
# Numeric for numbers only.
ƒ Function for calculated values.
▾ Dropdown for predefined options.
🖼️ Image for structured image uploads.
📈 Curve for continuous series (e.g. time–voltage or temperature–property curves).
📅 Date for point-in-time events (e.g. cure start date, sample collection date).
🕐 Timestamp for events with time precision (e.g. dwell duration, reaction start time).
Set units for each result
Consistent units in every column
For every result column, pick the unit that matches the value being recorded. This keeps results comparable across experiments and locations.
Open the Data Template that you want to configure.
Click the unit selector in the result column header.
Choose the appropriate unit, such as wt% for “Component A” or °C for “Temperature”. Other examples include Pa·s or your org-specific units.
Choose data types (validation)
Make entries clean & machine-readable
Data types control what can be entered in each column so results stay consistent and ready for analysis.
N Set “Temperature (°C)” to Numeric so entries like “room temp” are blocked, while values like 25 are accepted.
ƒ Use Function columns when a value should be calculated (e.g. averages or deltas) so Albert computes it directly in the template instead of external tools.
▾ Choose Dropdown when only a limited set of values should be allowed (e.g. “Pass / Fail”, a 1–5 score, or grade levels).
Date and Timestamp data types
Capture time-based data as structured results. Set a result's data type to Date for point-in-time events (e.g. cure start date, sample collection date) or Timestamp for events with time precision (e.g. dwell duration, reaction start time). These types enforce structured capture at the point of entry.
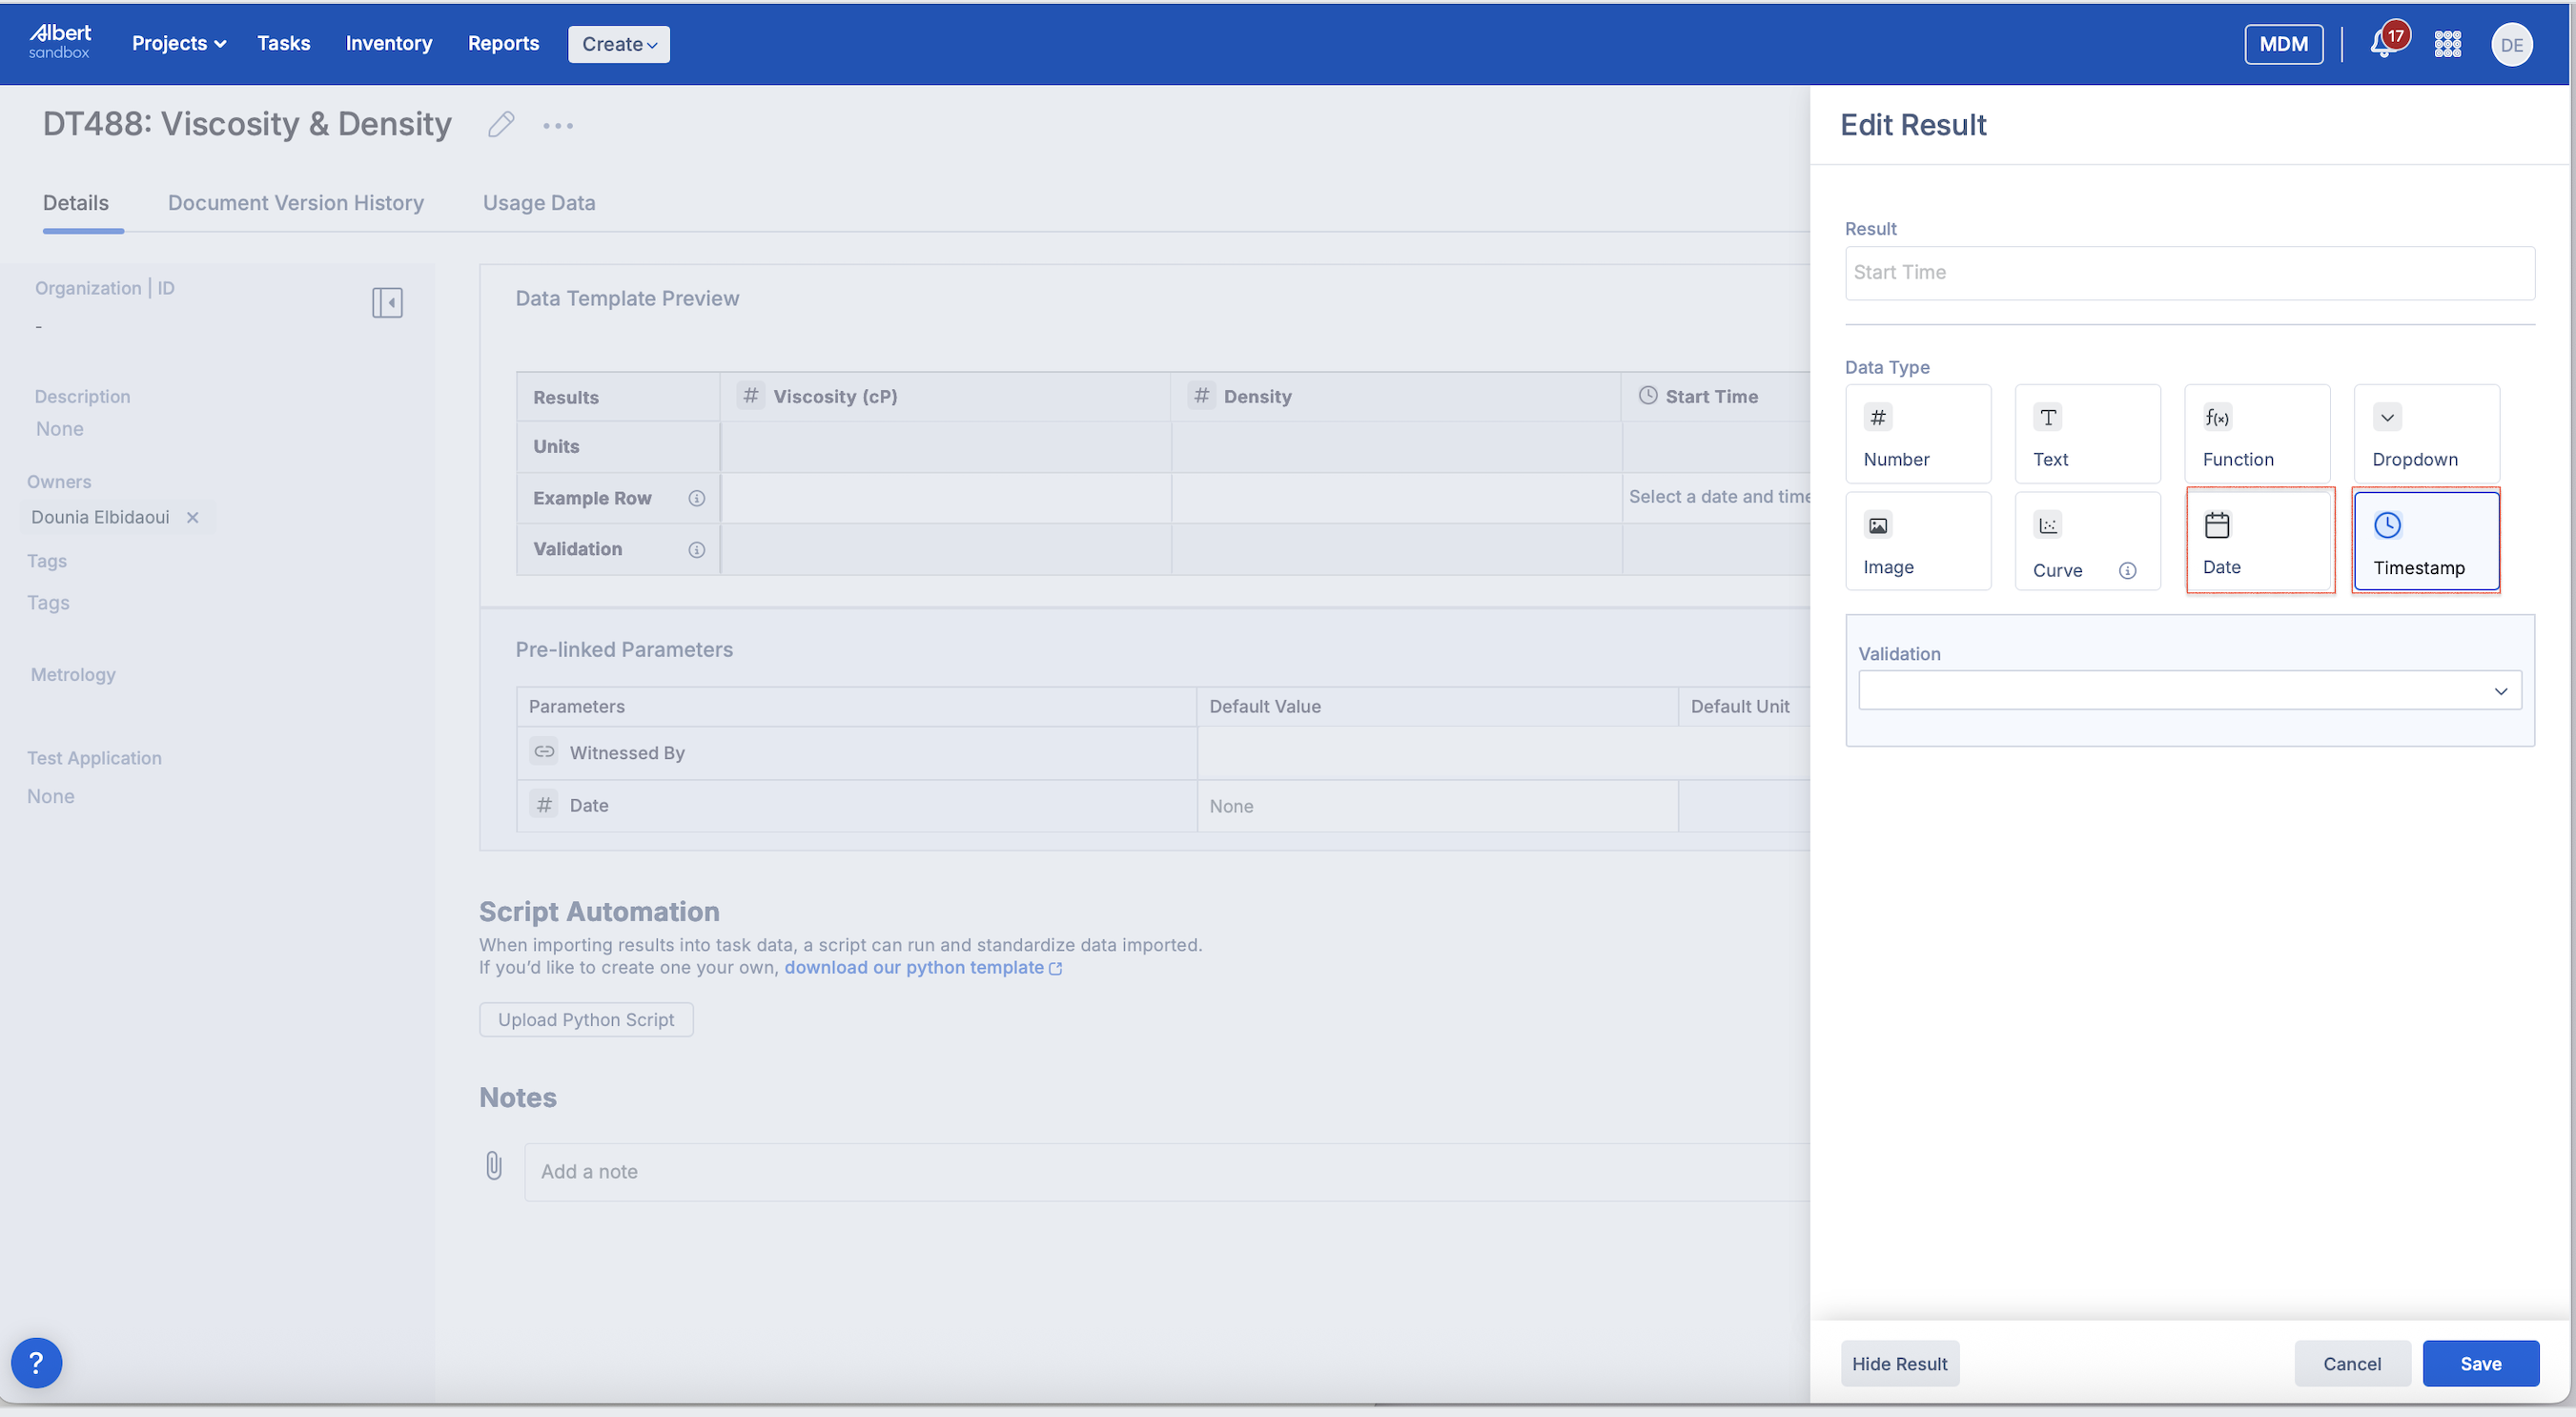
Change the result's data type to Date or Timestamp in the Data Template.
Users will see a date picker when working in tasks or worksheets, ensuring consistent date and time entry.
Date and Timestamp results appear in the Task view, in Reports, and in the result grid in the worksheet, ready for time-series analysis and date-based reporting.
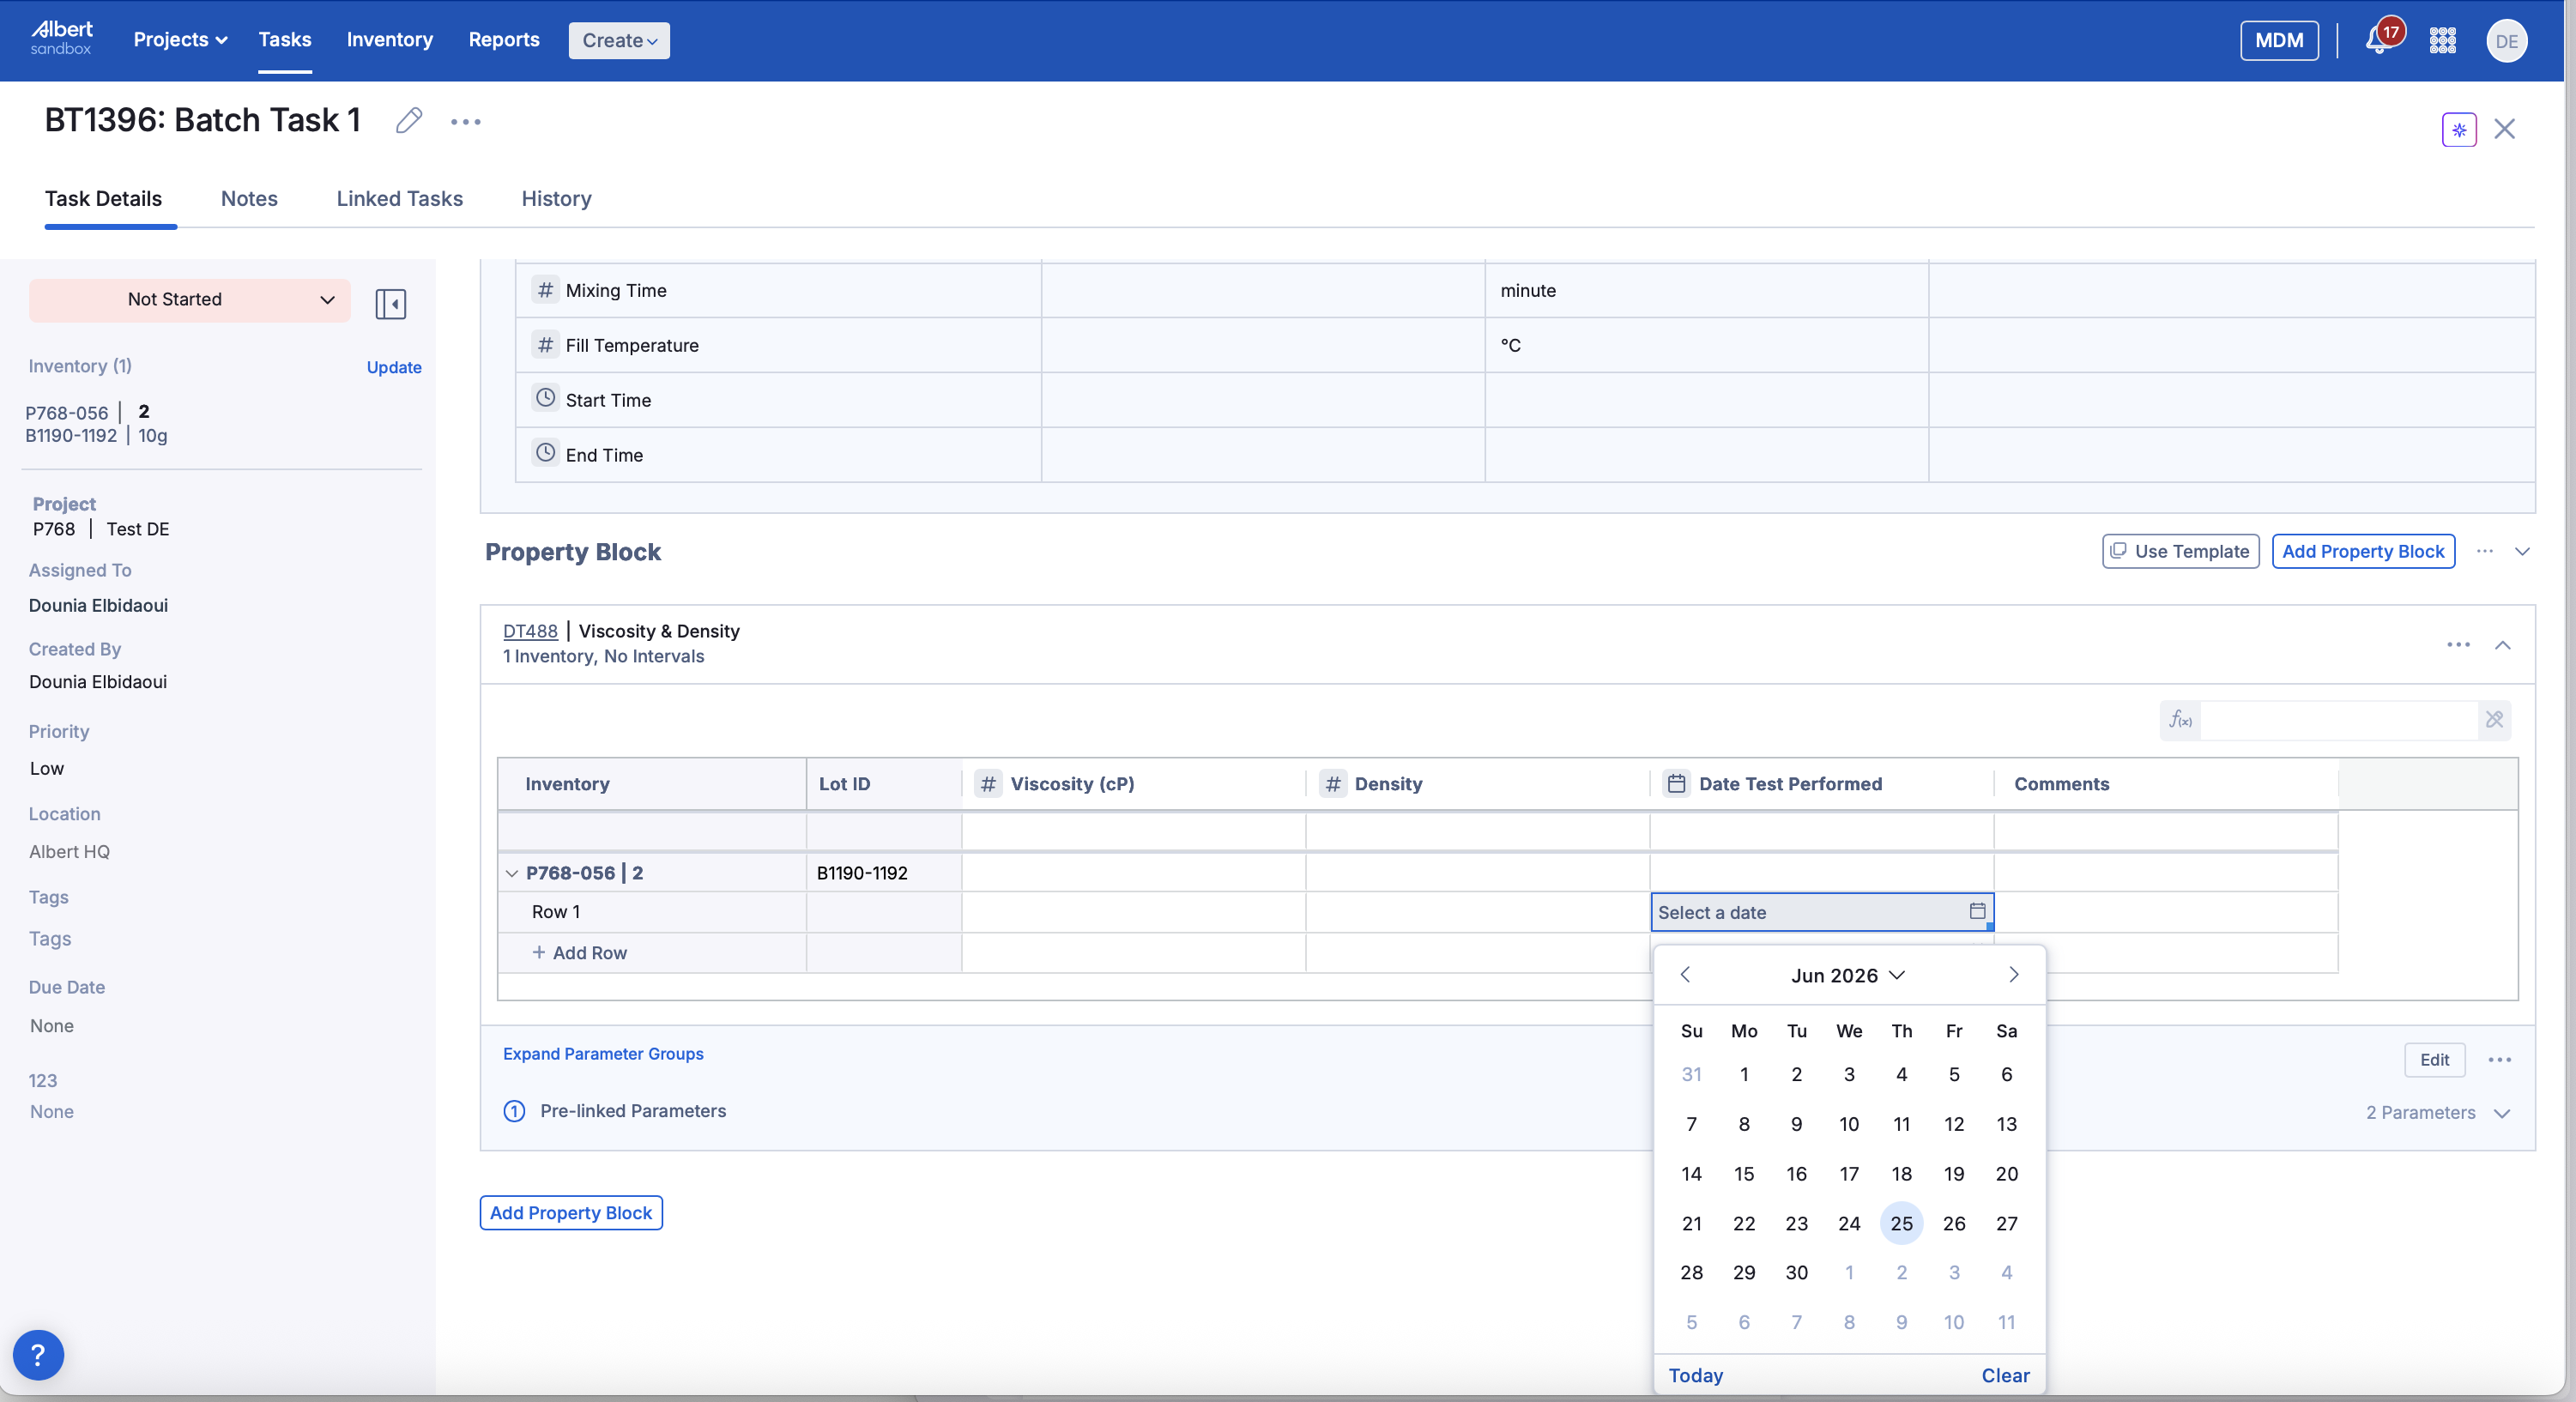
Image data type
Capture images as structured results
Set a result’s data type to Image when you want users to upload pictures as part of the result (for example, microscope images, plate photos, or visual checks).
Change the result’s data type to Image in the Data Template.
Users can upload one or more images directly into that result when working in tasks or worksheets.
The images will appear in the Task view, in Reports, and in the result grid in the worksheet.
✨ Tip: Pair images with a simple classifier score (e.g. 1–5) stored in a Dropdown or Numeric result. This keeps images for review and structured numbers for predictive capabilities with Breakthrough.
Curve data type (continuous data)
Capture continuous measurements as curves
Use the Curve data type when your results are measured continuously over an axis (for example time, temperature, or frequency) instead of as a single summarized value.
Configure which columns in the CSV act as the X- and Y-axes in the Data Template (for example time vs. voltage).
Users upload curve files directly from Tasks; Albert stores the full curve, not just summary points.
Clicking a curve file opens an instant curve report using the axes defined in the Data Template.
Current limitations: Curve data caps discrete data entry at 1000 rows, only supports curves from a single CSV at a time (no cross-sample overlays yet), and is not yet available in calculations. Future releases will add richer overlays and reporting for continuous data.
Pre-linking Parameters
Parameters capture the conditions of the test (e.g. temperature, instrument). Pre-linking them to a Data Template ensures this context is always collected.
Typical Parameters
Temperature, humidity, pressure.
Instrument or method version.
Sample ID, batch or lot.
Why pre-link?
Reduce manual setup for each new task.
Ensure key conditions are always captured.
Standardize context across teams and sites.
Pre-link Parameters to your template
Open the Data Template you want to configure.
Add individual Parameters.
Mark critical Parameters as required if tasks must not be created without a value.
When someone creates a Property Task using this Data Template, all pre-linked Parameters appear automatically, saving setup time and preventing missing context.
Important: If a Parameter is marked required, task creation will be blocked until a value is provided.
Script Automation
Script Automation lets you attach Python scripts to Data Templates to transform raw data (for example from instruments or files) into structured results in Property Tasks.
For a deeper dive, see: Script Automation with Data Templates.
Typical inputs
Instrument exports (CSV, Excel, proprietary formats).
Other raw data files from lab equipment.
Typical outputs
1Filled-in result columns mapped from the source data.
2Derived metrics and calculations stored as results.
3Consistent formatting and units for downstream analysis.
Attach a script to a Data Template
Open the Data Template you want to automate.
Go to the Script / Automation section.
Click Upload Python Script.
Select your
.pyfile and upload it.
Why use scripts?
Scripts turn repetitive, error-prone data entry into a fast, reliable pipeline from instruments to structured results.
Less manual work, cleaner data
Automated data capture
Pull instrument exports directly into the right result columns instead of copy-pasting.Improved accuracy
Reduce transcription errors and mismatched units by letting the script handle parsing and mapping.
Smarter, scalable workflows
Custom transformation
Clean, reshape, and calculate exactly what your team needs using your own Python logic.End-to-end automation
Connect data generation, processing, and analysis so results are ready to use as soon as tasks are completed.Scale
Handle large batches and complex datasets with the same effort as a single run.
If you want to use script automation but don’t have Python expertise, reach out to your Albert Administrator or your Albert representative.
Manage Translations
Use translations to make the same Data Template usable for teams in different languages, without duplicating templates.
Why translate?
Make templates easier to find in search and views for non-English users.
Reduce duplication of templates across regions.
What gets translated
Data Template name.
Result column names.
Parameters and Parameter Groups.
Add translations
Open the Data Template you want to localize.
Navigate to the Manage Translations page.
For each available language, provide translations for the template name, result names, and any linked Parameters or Parameter Groups.
Users will see these translated values in tasks, search results, and other places in Albert, making templates easier to find and understand.
The languages you see under Manage Translations are currently supported. To request additional languages, contact your Albert representative.
Best Practices
Use these practices to keep your Data Templates reliable, reusable, and easy for colleagues to work with.
Design
Align templates with ASTM, ISO, or internal methods where applicable.
Use clear names and descriptions instead of generic titles.
Create separate templates for distinct test types rather than one catch-all.
Data quality
Set units for each result and keep them consistent.
Use appropriate data types (Numeric, Text, Dropdown, Function, Image, Curve).
Mark critical Parameters and results as required.
Lifecycle
Pilot new templates with a small group before full rollout.
Document what scripts do and what inputs they expect.
Review templates periodically to keep them aligned with current processes.
Troubleshooting
Use these quick checks to diagnose common issues before escalating.
Access & structure
Can’t create or edit templates: check your role (e.g. Champion, Administrator) and contact your Albert Administrator if needed.
Missing result names: try alternate spellings or ask an admin to create the definition.
Validation & automation
Data won’t save: make sure values match the column type (numeric vs text vs dropdown vs image vs curve).
Script issues: confirm the correct script is attached, check for errors, and verify input files match what the script expects.
Translations not showing: verify translations exist for the right language and your user language matches.
Validation & saving errors
Check data type: Numeric columns only accept numbers.
Remove units from values: enter
25instead of25 °Cin numeric fields.Dropdowns: select one of the allowed options instead of typing free text.
Images: make sure you’re uploading a supported image file type for Image fields.
Curves: upload CSV files where the columns match the X/Y axes configured for the Curve result in the Data Template.
FAQ
Quick answers to common questions about Data Templates.
Ownership & editing
Who can create templates?
Typically, Albert Champions or Albert Administrators.Editing in-use templates:
Changes affect future tasks. For major changes, duplicate the template and migrate users.
Usage & automation
Relation to Property Tasks:
Tasks use Data Templates as the output structure for capturing results and parameters.Images in results:
Yes — set the data type to Image to store images in tasks, reports, and the worksheet result grid.Do I need a script?
No. Scripts are optional and mainly for automatically loading data from instruments or files.
Need more help with Data Templates? Contact support.