
Smart Projects Overview
In the lab, all projects start with goals. This can be external requirements from customers, internal criteria, or specific specification targets.
With Smart Projects you can classify and define your goals into targets, and have them live update as you capture structured data into Albert. You can also generate instant reports and visualizations to check or measure progress at any time.
Define and Track Project Targets:
This video is a walkthrough on the process of creating a new Target.
Selecting a Target Result:
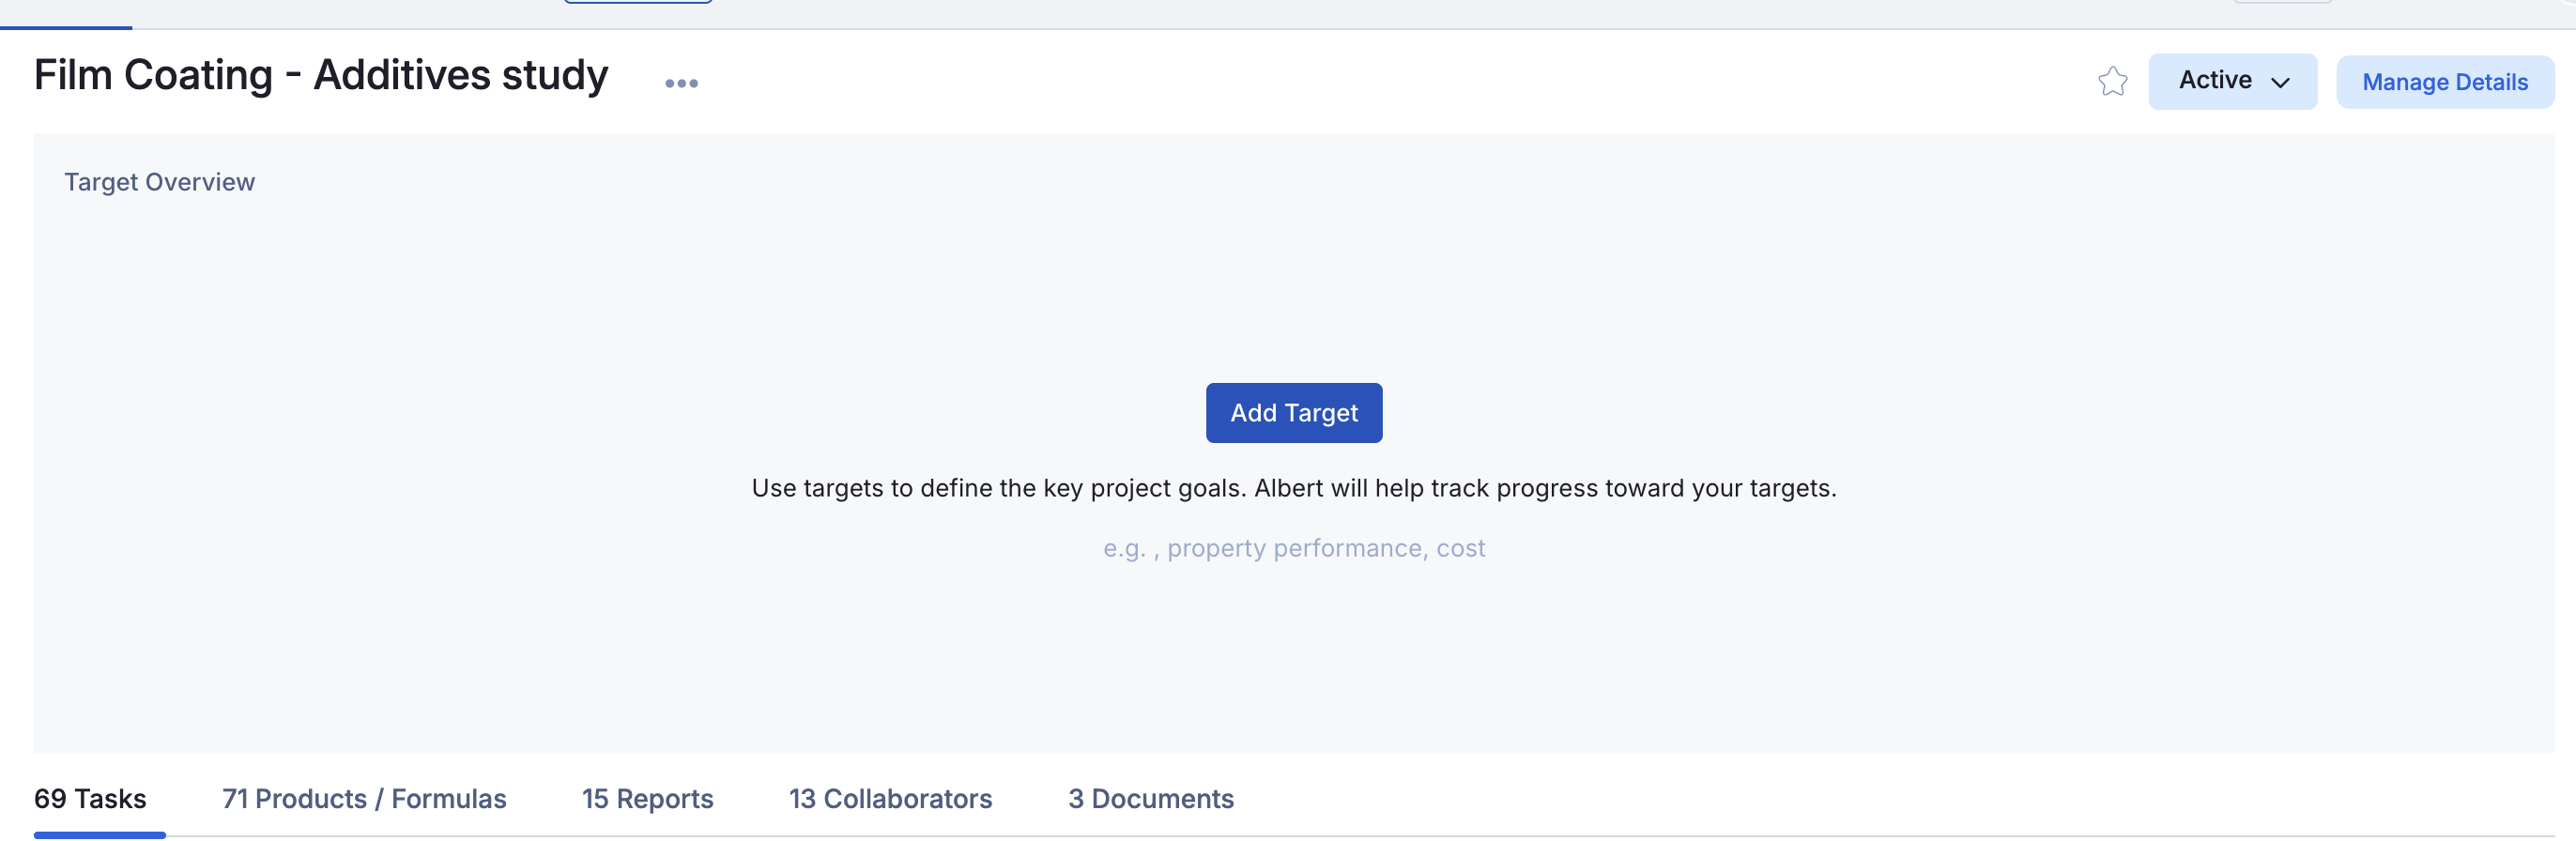
The Smart Projects grid is available on all projects. If you haven't previously set any values in the grid, you will see the Add Target button.
This opens the Add Target menu. First, define your data template, and associated Result value (Data Column) you wish to track.
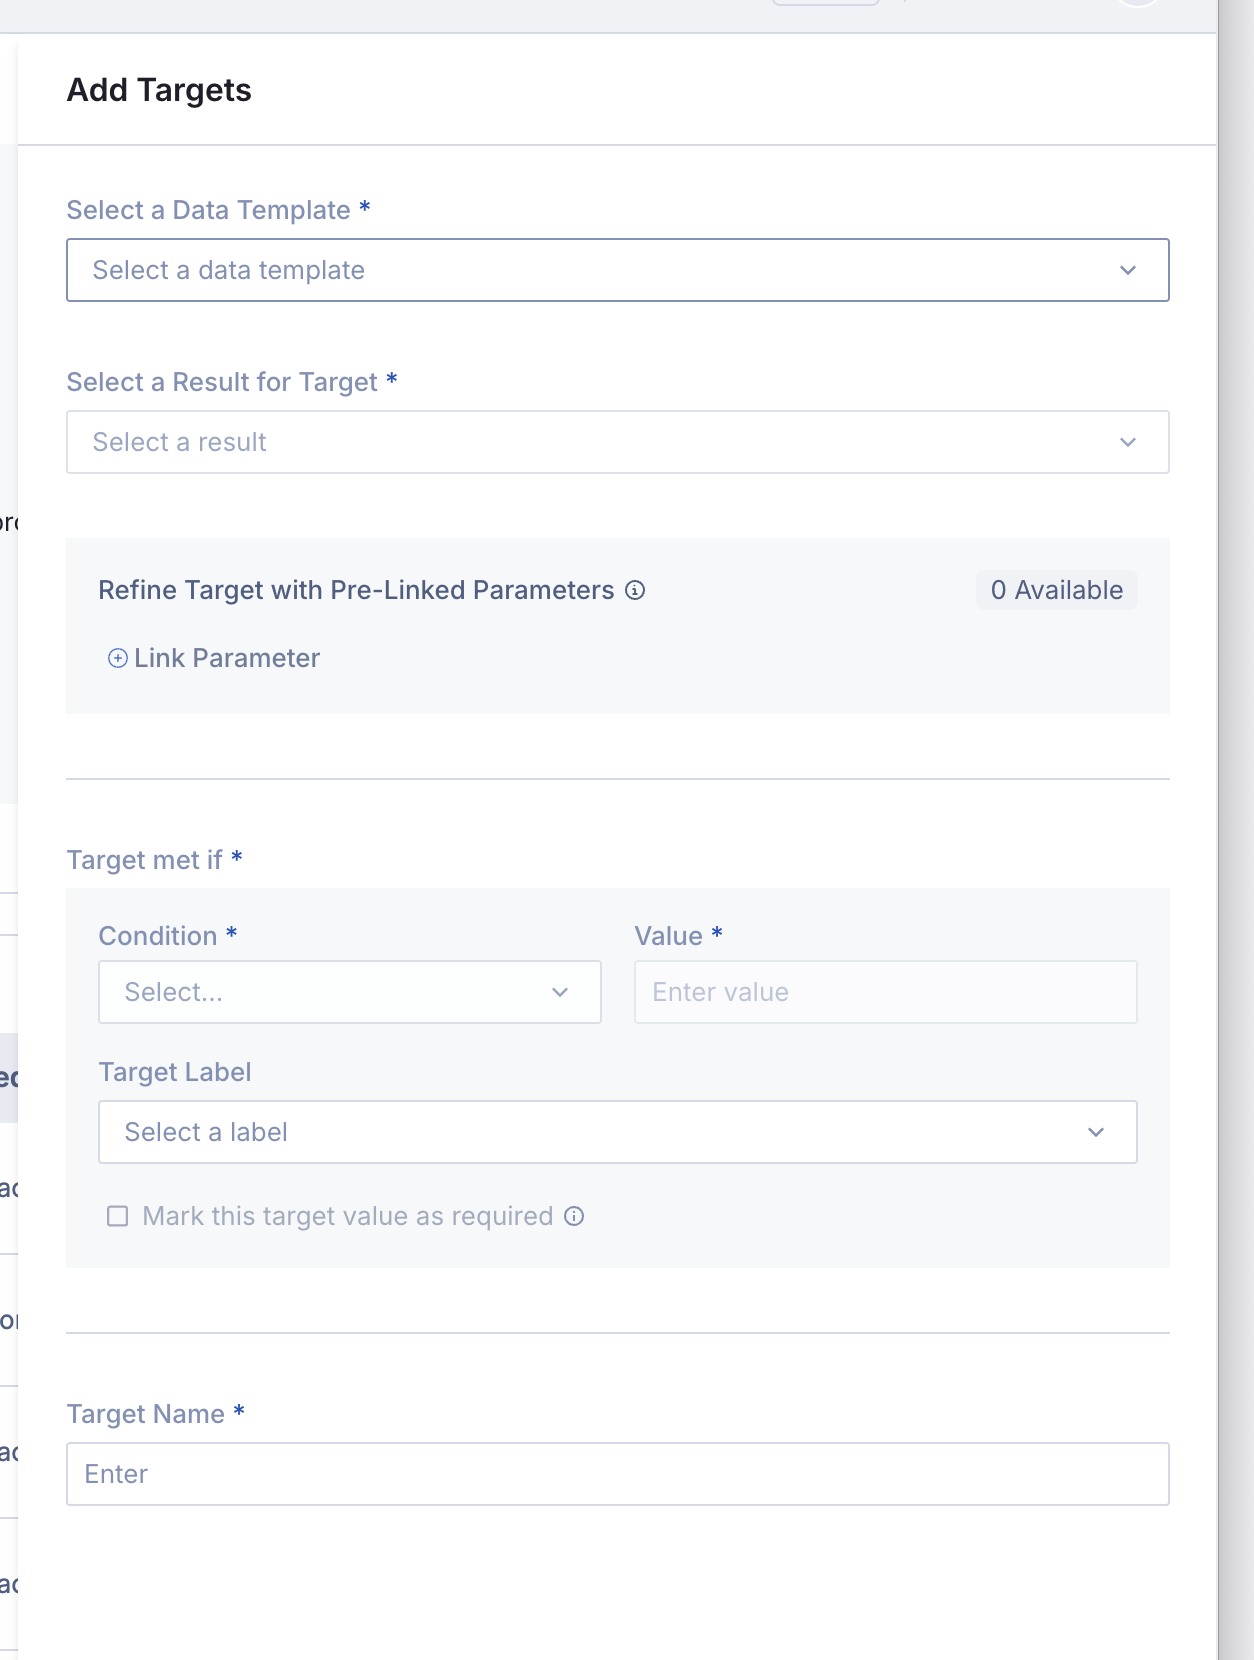
On initial release, only Number and Drop-Down type Data columns are supported.
Text, Calculation, Image, and Curve Data Columns are not supported at this time.
If your needed data column is not currently selectable, please contact your Albert Administrator to update your Data Template.
Associate Parameters with the Your Value:
Once that is defined, you can optionally link any parameter values to your result. This is helpful in cases where you may be using Intervals, or if you can have result values at different parameter points. Using the example below, I'm using the Temperature parameter associated with my Viscosity value.
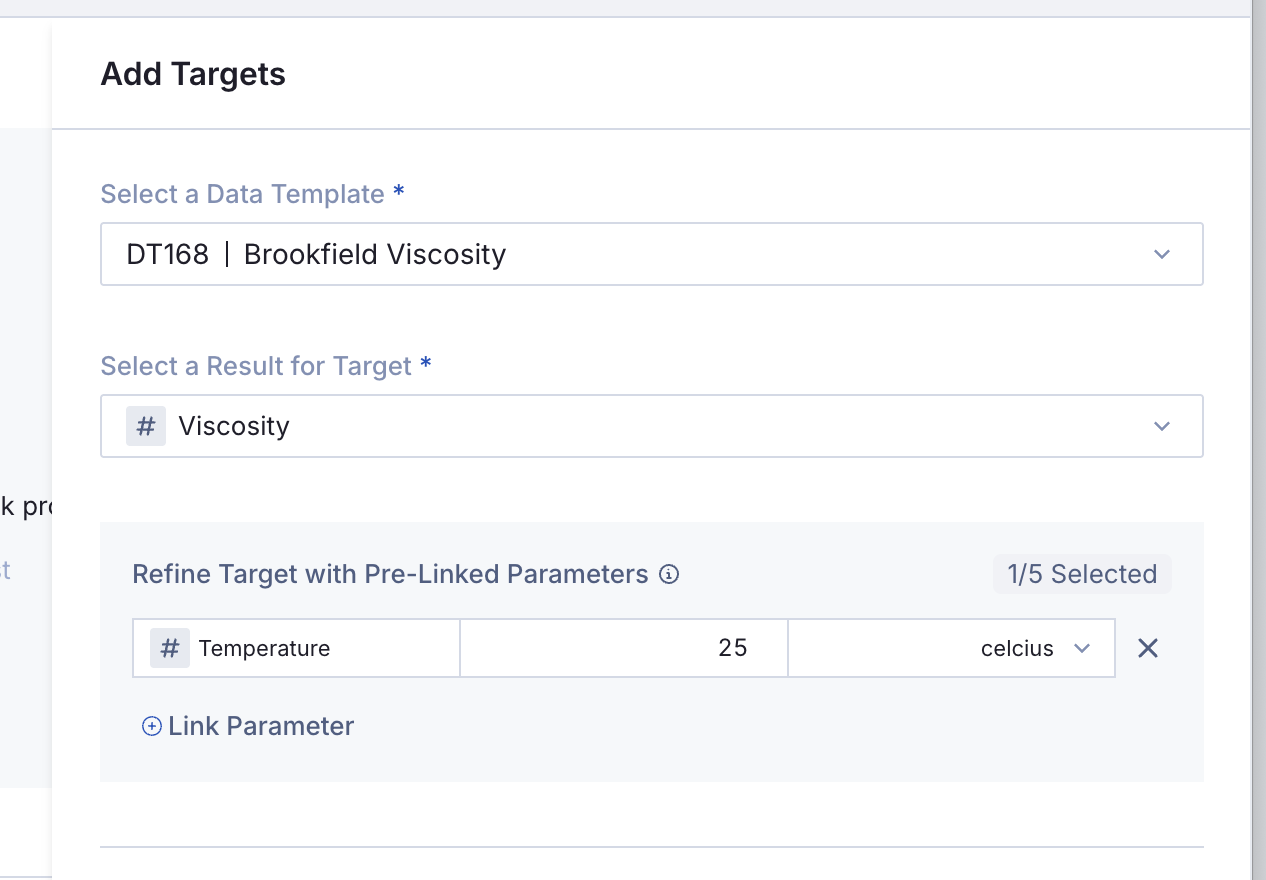
If I wanted to compare across parameters, I can do that across targets as well. For example, I can have 1 target for viscosity at 25C, and another target for viscosity at 100C.
Parameter Selection - Pre-Linked vs Parameter Groups:
When you choose to define a parameter, you have two options, Pre-linked Parameters and Other Parameters.
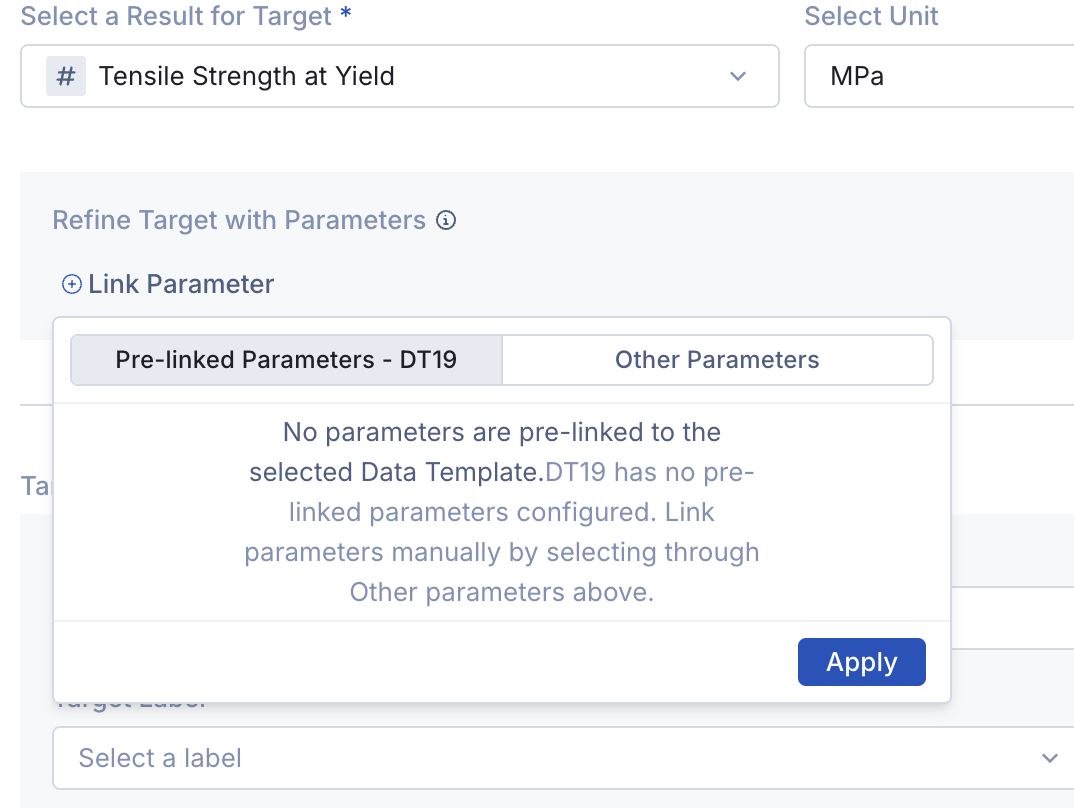
Pre-linked Parameters are those that are defined on the Data Template directly. If you are interested in learning more about Pre-Linked Parameters, check out this feature's section in the Data Template Overview article.
If you are not using Pre-linked parameters, you can choose Other Parameters. This will open a search window where you can search by Parameter Group, and then select the specific parameter(s) associated with your target. Lastly, remember to click Apply at the bottom of the Parameter Window.
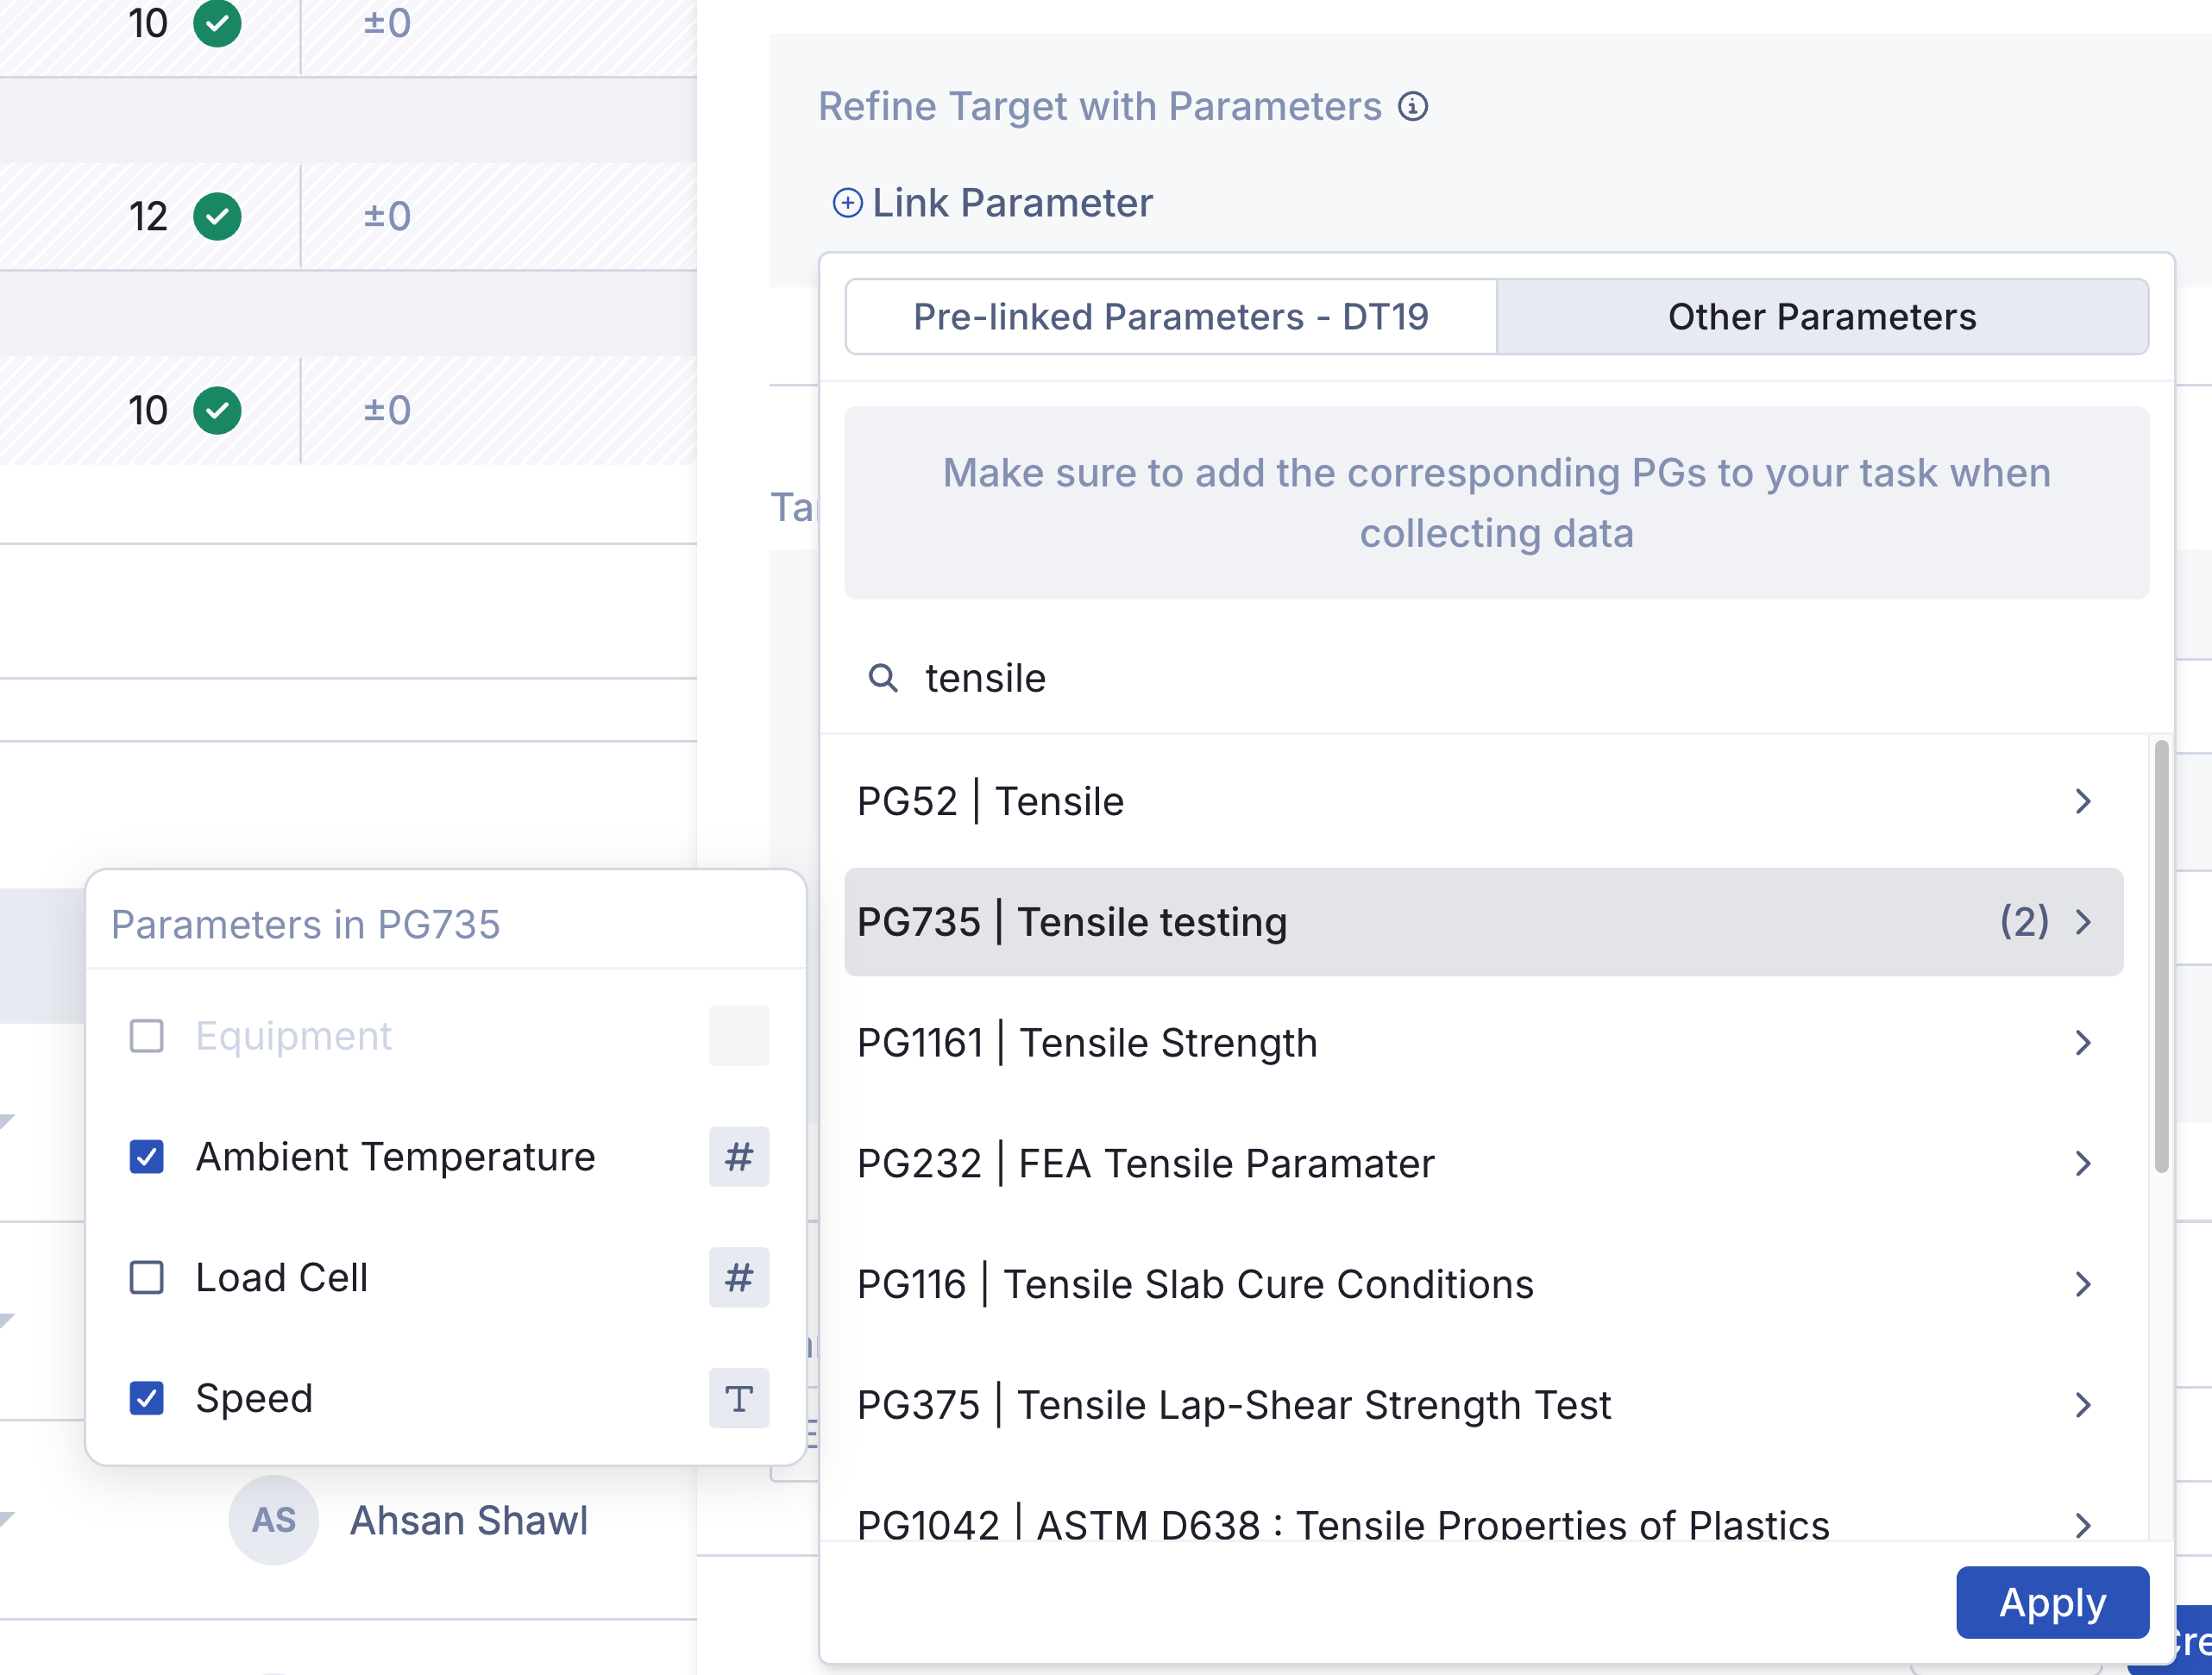
When using Parameter Groups, make sure that the same Parameter Group, Parameter Value, and Parameter Unit are used in tasks as defined in your target. Otherwise the data will not link back to the grid.
On initial release, inventory linked parameters such as Equipment or Consumables are not supported Parameters.
Target Criteria:
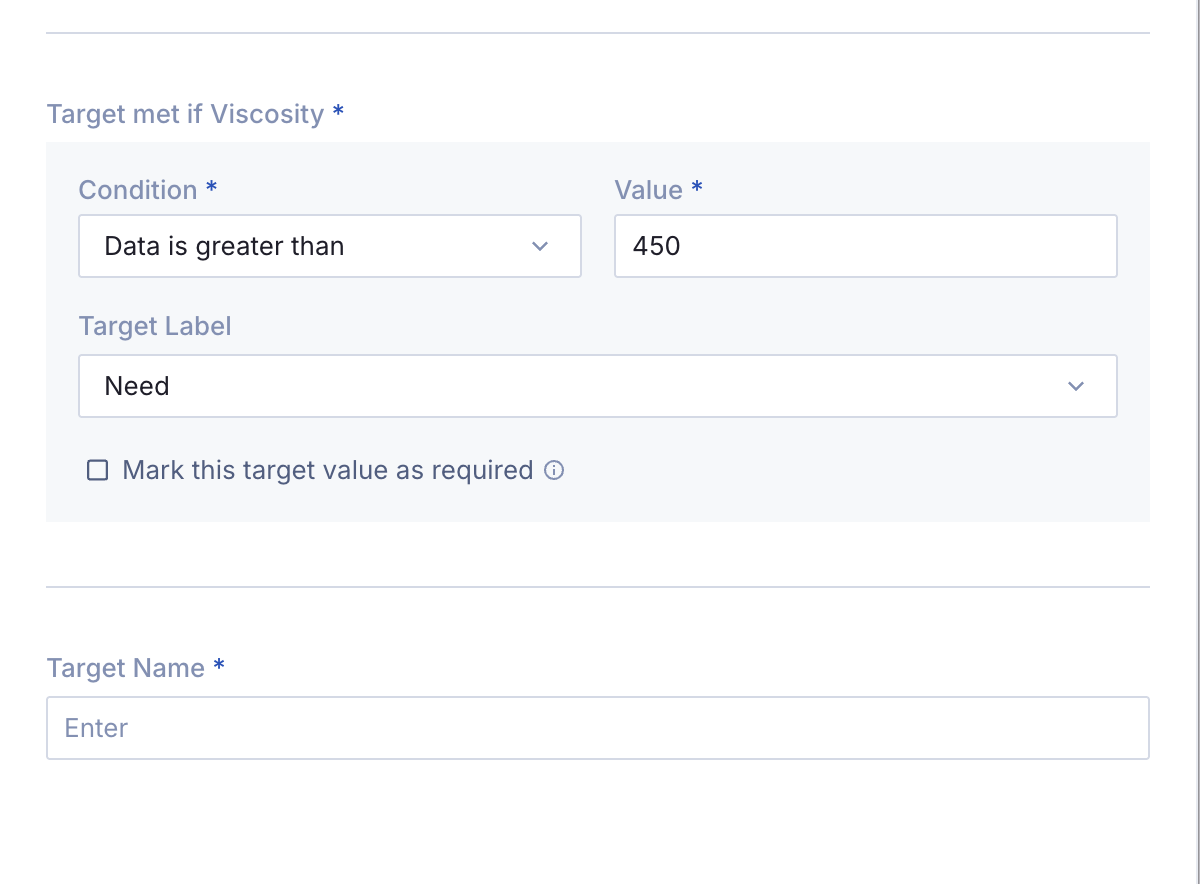
Once your result & parameters have been defined, you can then set the criteria of your target. Your Product/Formula will recieve either a pass or fail rating based on what you define in this section.
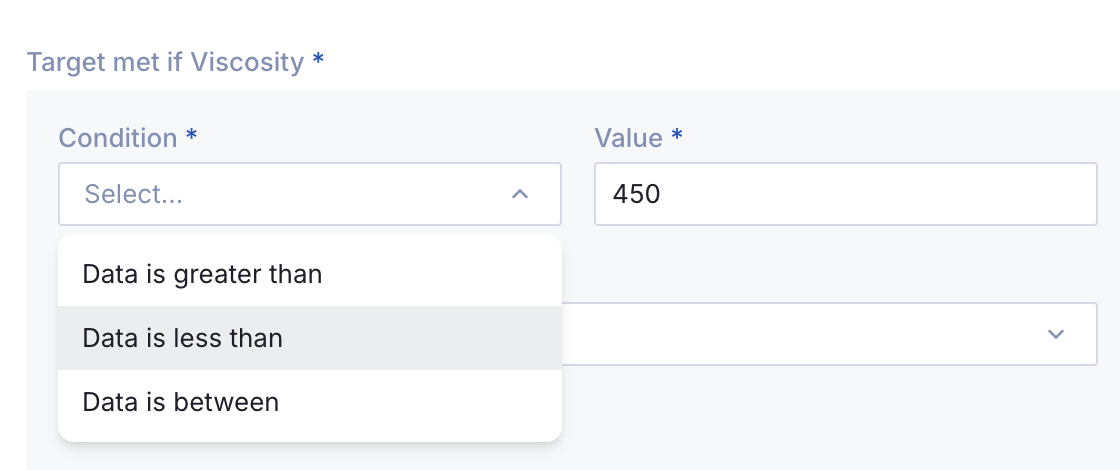
Numeric Targets:
For numeric values, you can choose between Greater Than, Less Than, or Between when defining your target criteria.
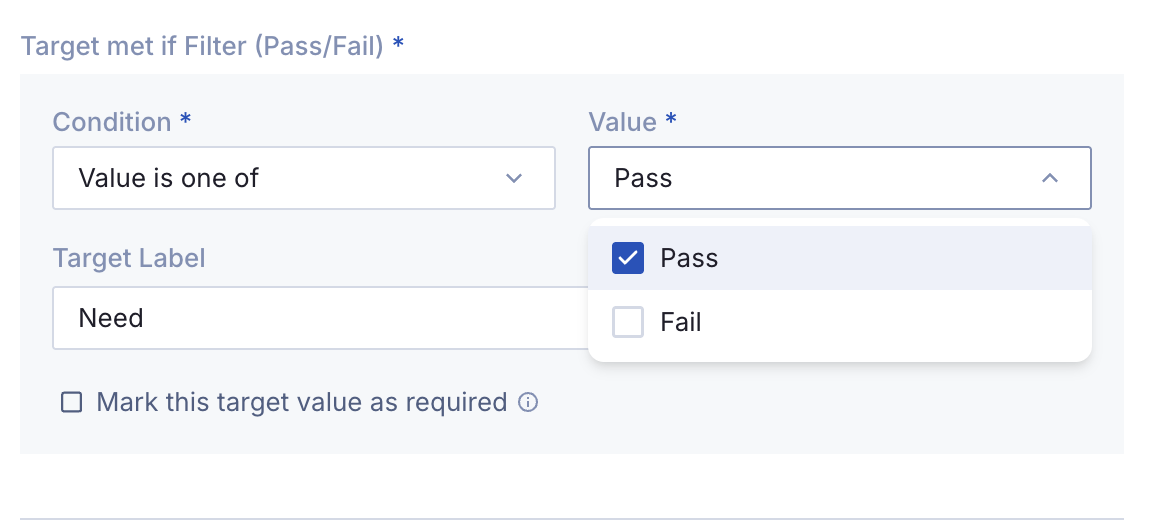
Drop-Down Targets (Qualitative):
For dropdown results, you can choose Value is one of as your condition. You can then select one, or many from the options for determining what your pass criteria ia.
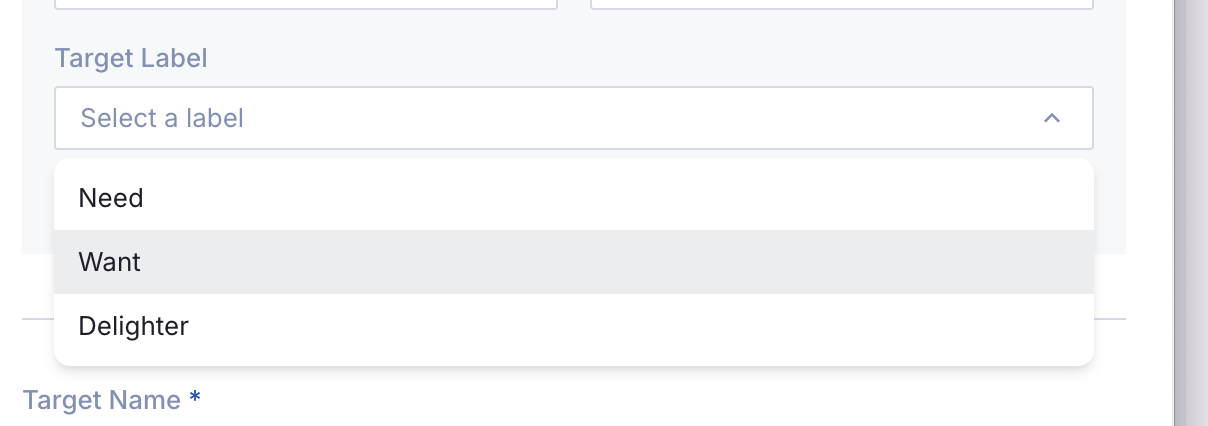
Target Label & Set as Required:
Lastly, you can assign a label and set if your target is required. Labels are used to group your targets in the grid.
Albert has the following labels available to make categorizing your targets easy:
Need
Want
Delighter
Right under the label is a checkbox, Mark this target value as required. This lets you define that this target has to be met for the project to be considered a success.
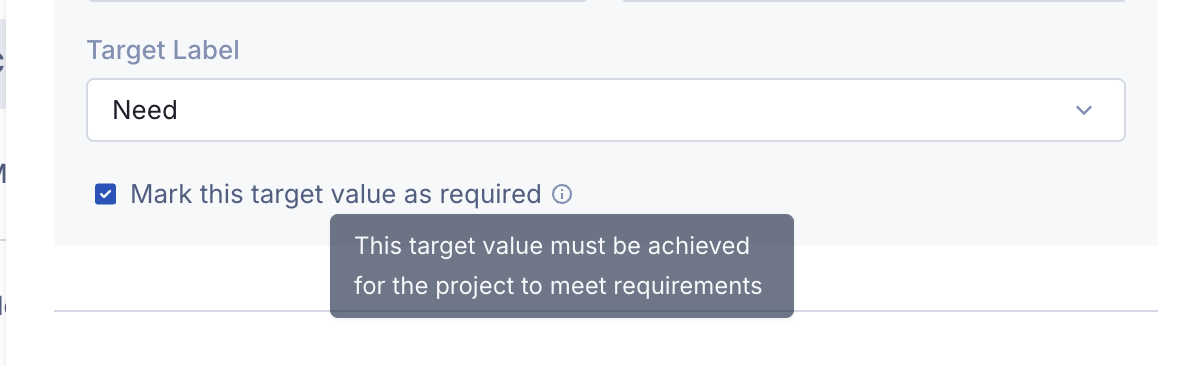
The very last step is assigning your target a name. You can use whatever naming convention you prefer, we recommend including your result & parameter name for quick understanding.
Using the Targets Overview Grid:
Tracking Progress Throughout the Project:
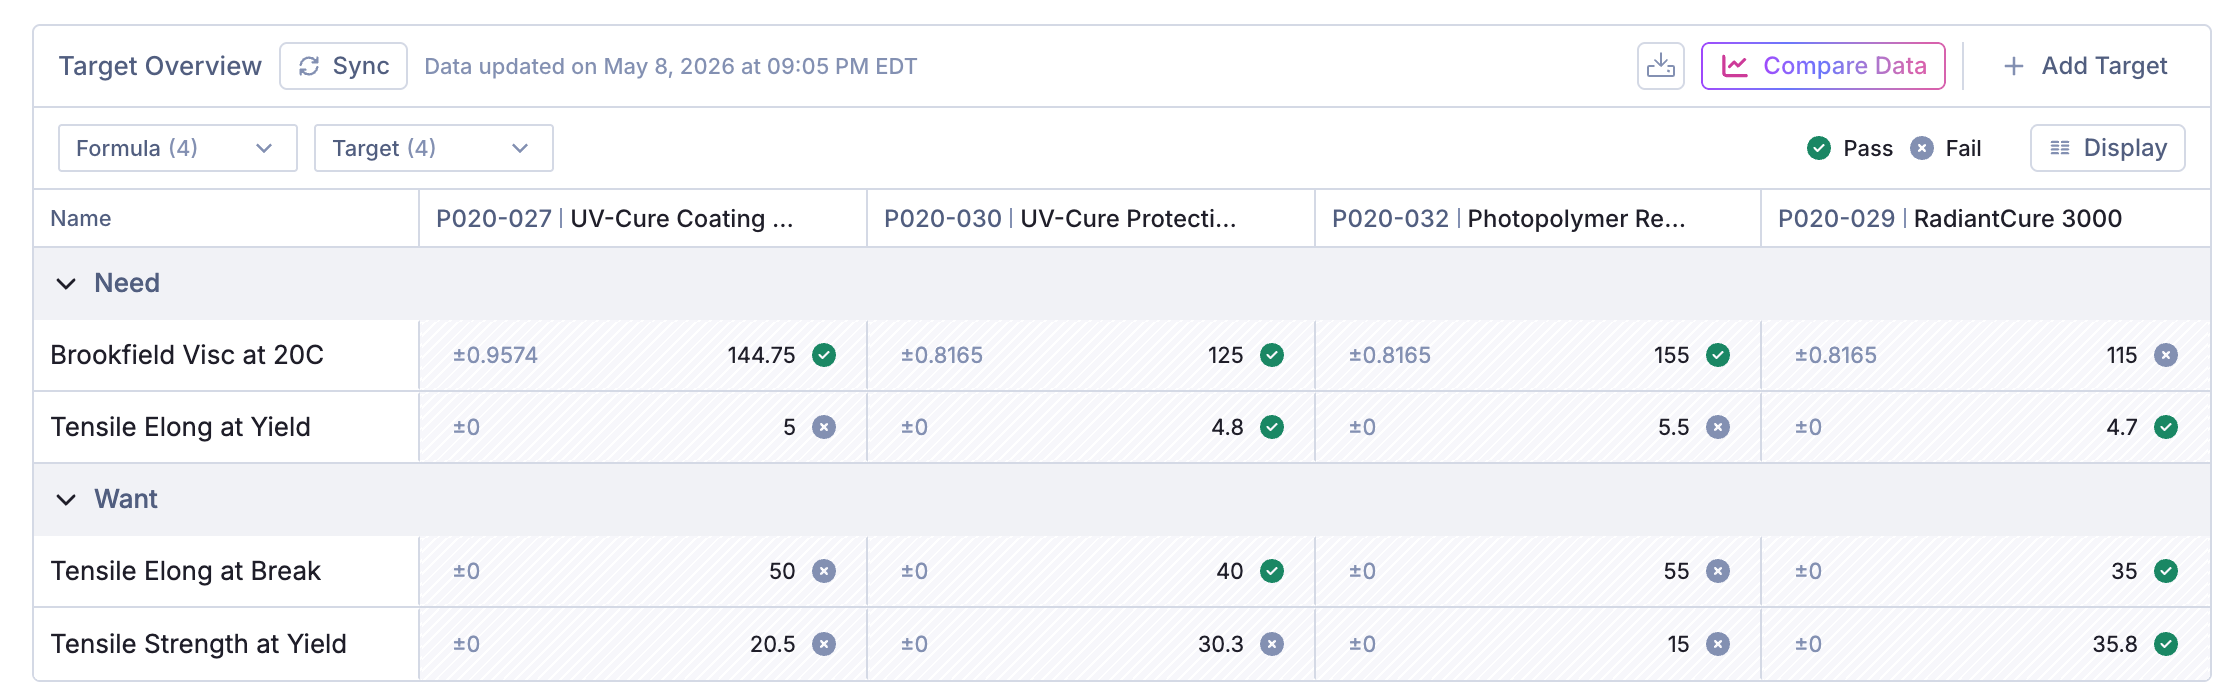
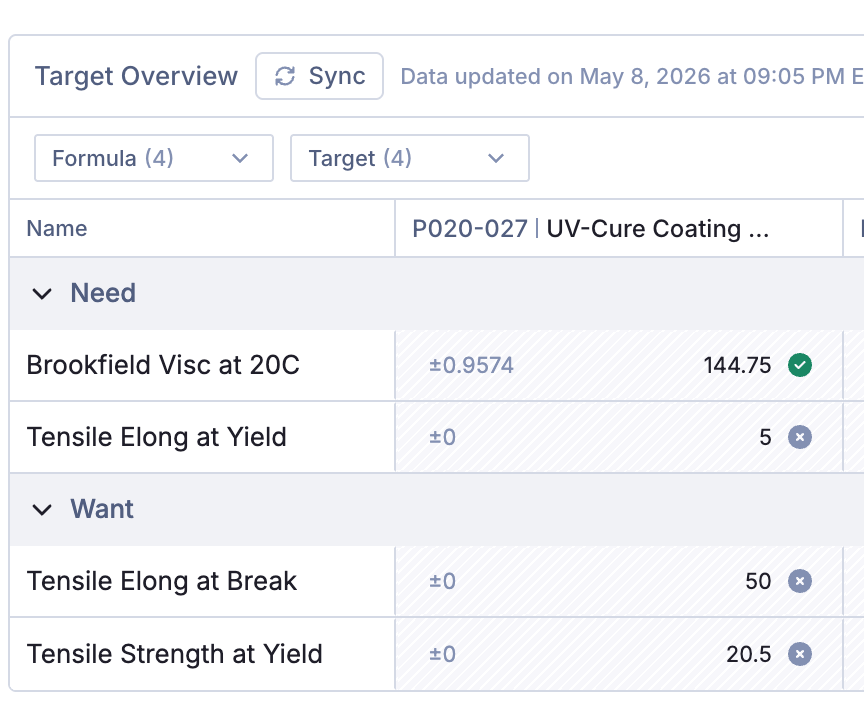
During the course of your project, as you enter data, those results will be visible in the grid, tracking progress towards meeting your targets.
Syncing your Dataset:
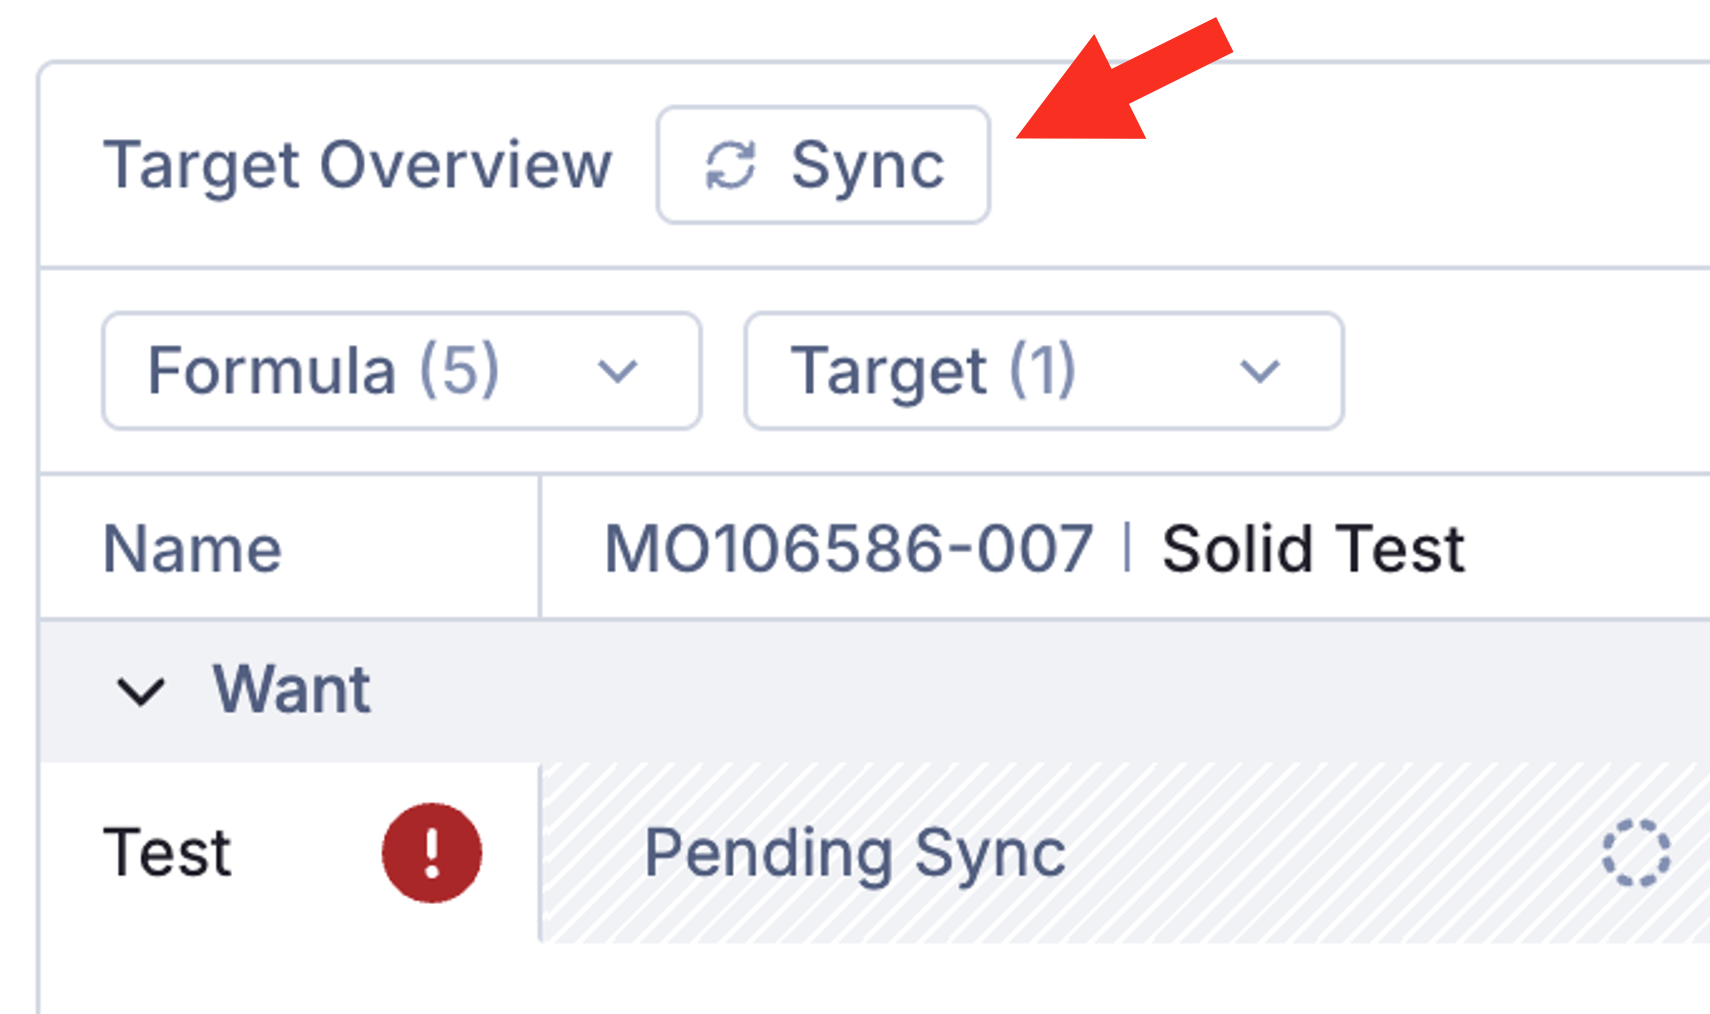
At any time, you can click the Sync button at the top of the grid to refresh the data in the grid.
When you first create your targets you may see a warning symbol and Formulas will say Pending Sync. Clicking the Sync button will pull the most up-to-date data from your project into the grid for use.
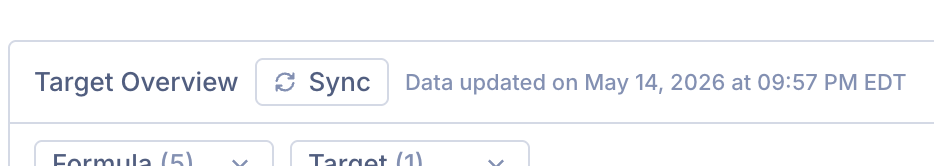
After syncing for the first time, you will see a Timestamp of the last time the grid was synced. Syncing is a very quick process, so it's recommended to sync often, and prior to creating any charts for data comparison.
Selecting your Products:
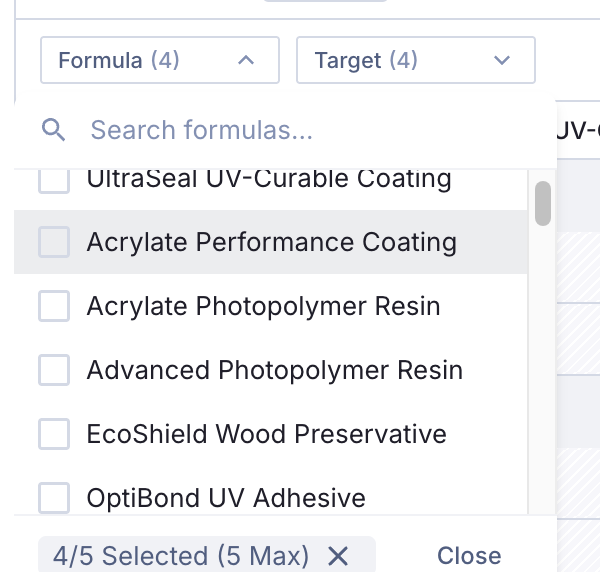
The targets grid allows you to compare up to 5 Formulas at a time. As needed, you can select different formulas using the Formula dropdown in the top-right. You can also toggle on and off your targets if needed.
Manipulating the Grid:
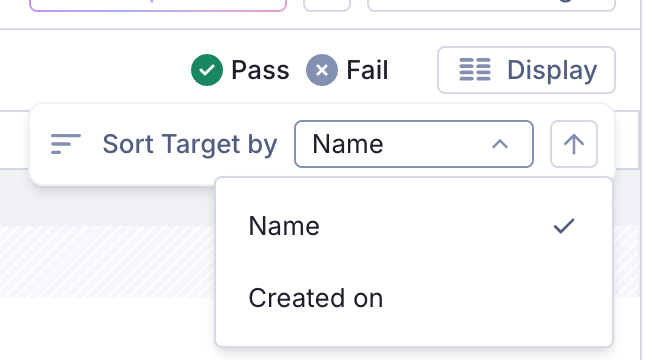
At the top right, you have the Display button. This allows you to control the ordering from within your label sections either alphabetically by Target name or by creation order.
Visualize Your Data:
The video below is a quick walkthrough on creating charts with Smart Projects.
Create Charts & Graphs:
Using the Compare Data button, you can generate instant visualizations of your data.
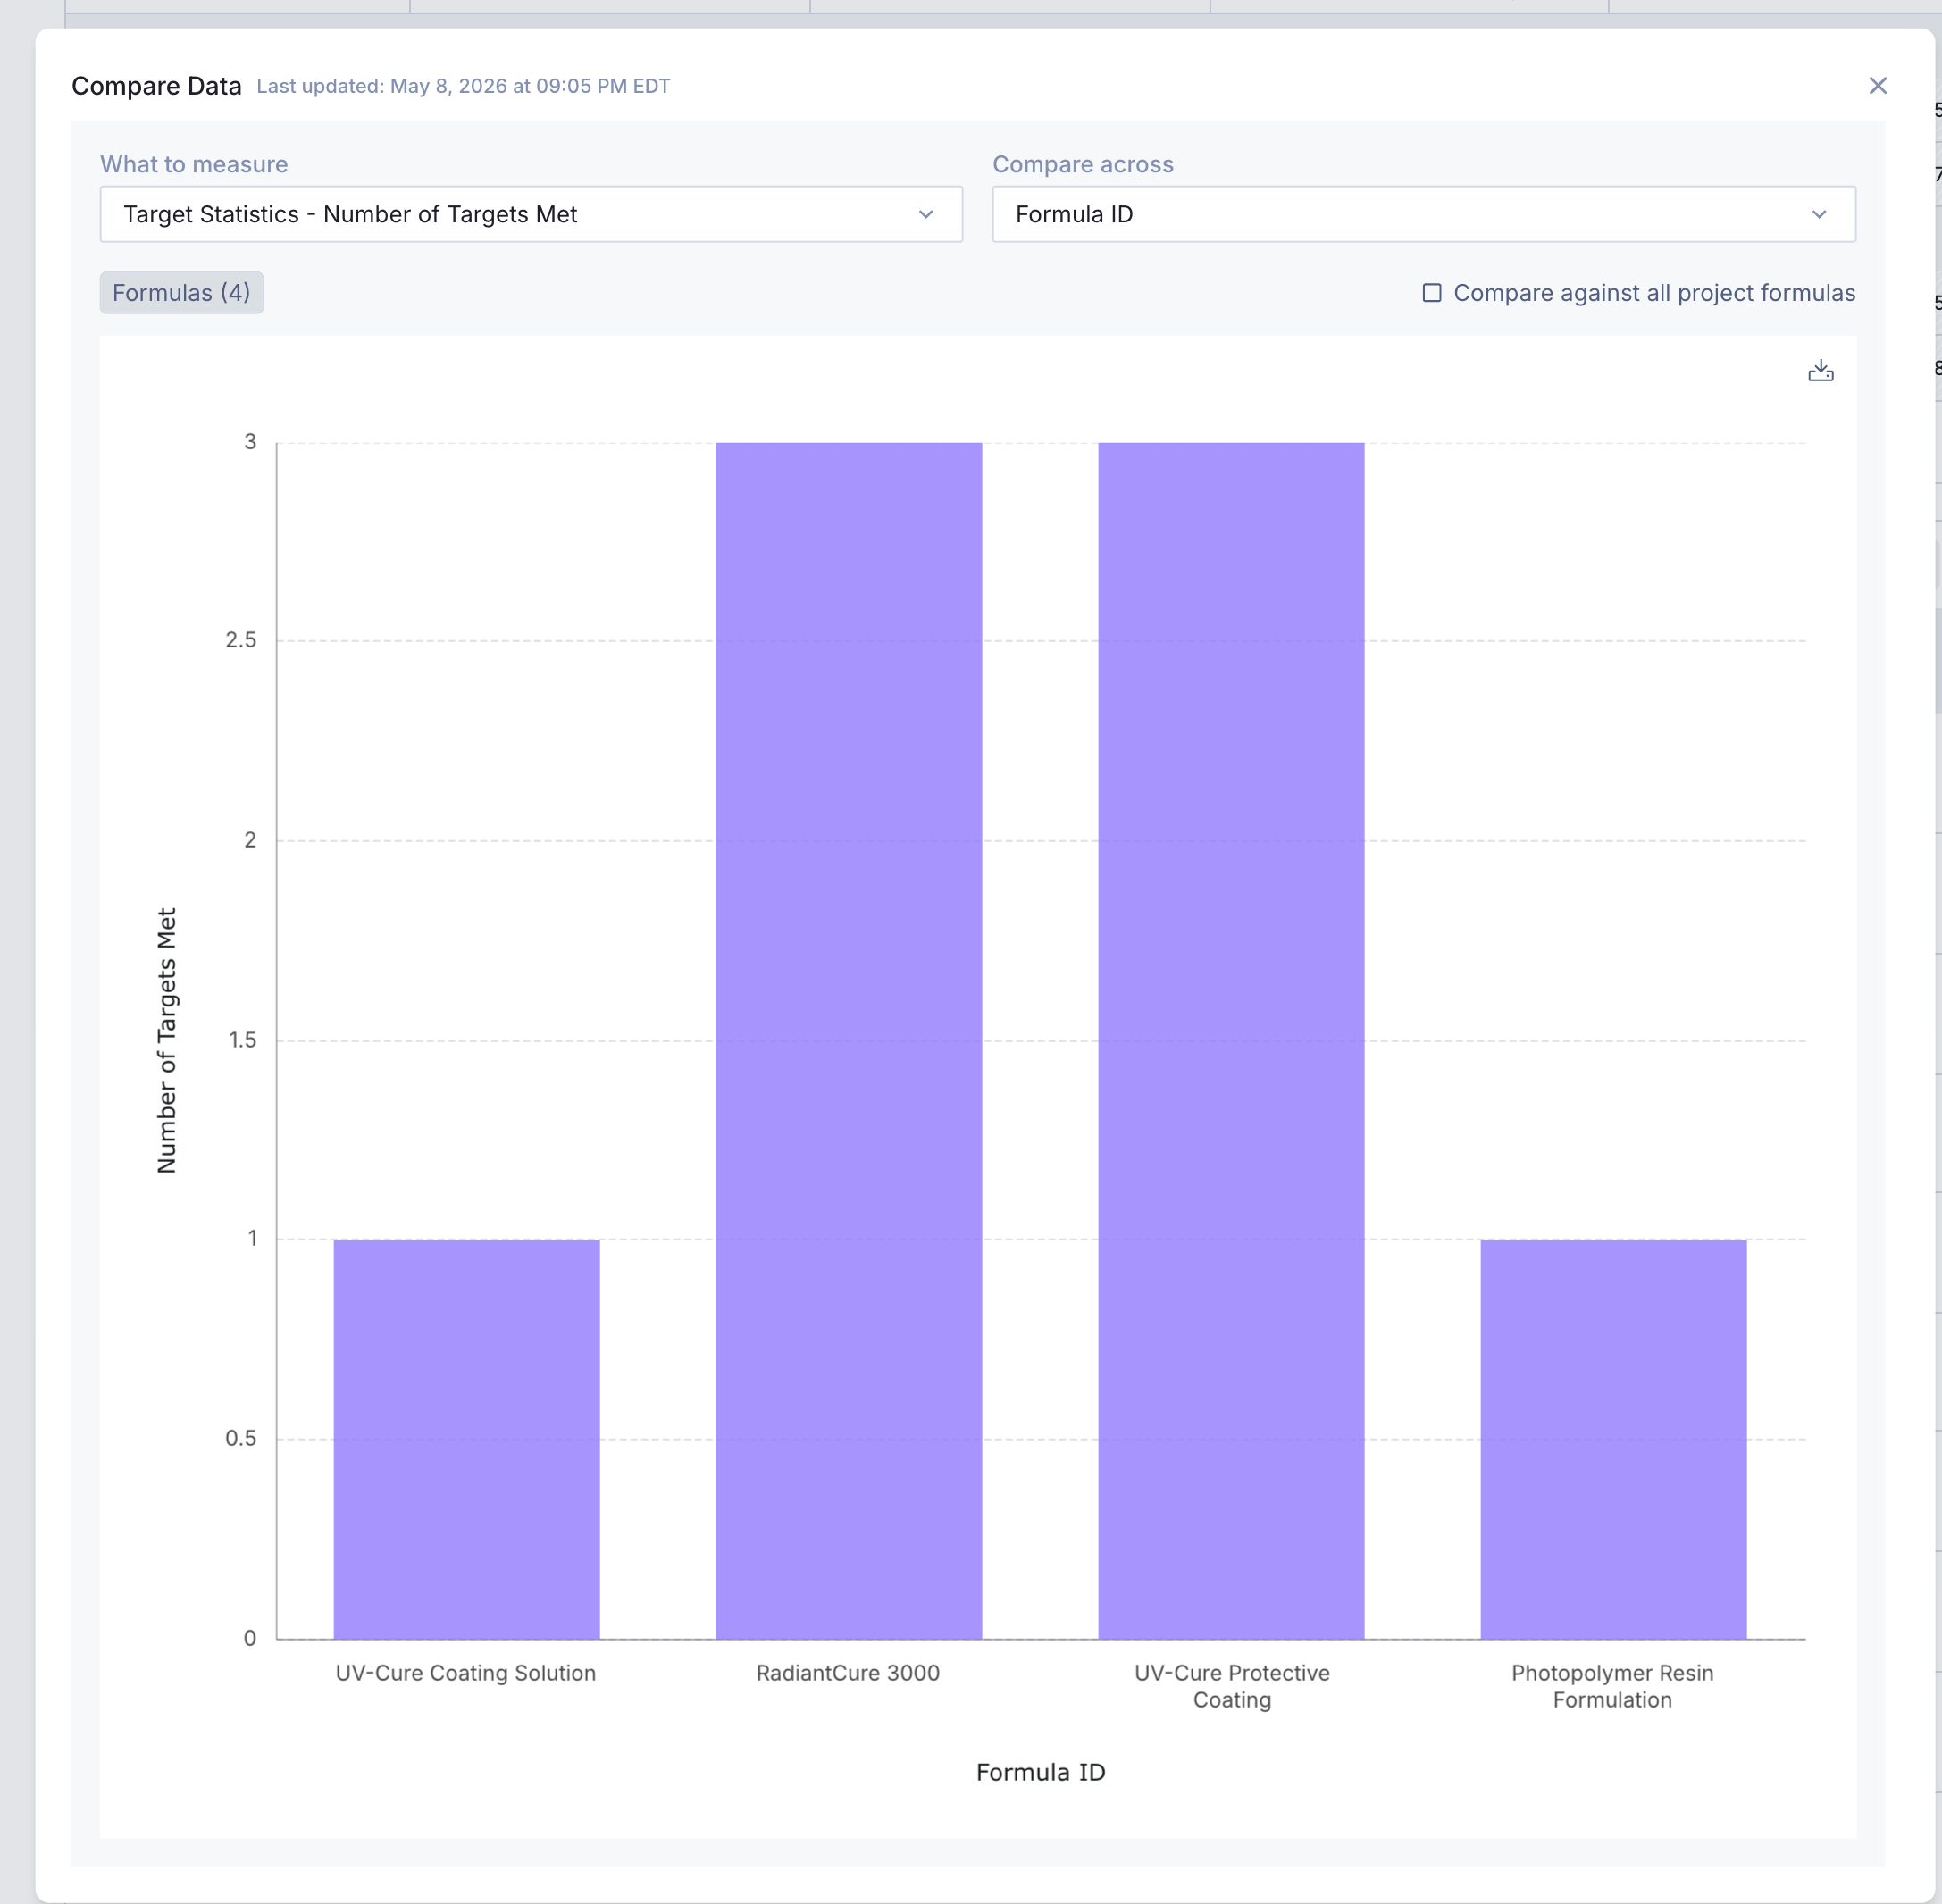
There's only two boxes to define to create your graphs, your X-axis and your Y-Axis. What to measure refers to the Y-axis, while Compare Across is the X-axis. Smart Projects will automatically toggle between chart types based on your selections.
What To Measure Options (Y-Axis) :
There are three Categories of Y variables:
Target Statistics
There are two options, Number of Targets Met and Fraction of Targets Met. These let you track completion towards targets.
Numeric Targets
This category lets you generate charts by selecting a specific target. Great for reporting specific values, or comparing target values vs Inventory concentration.
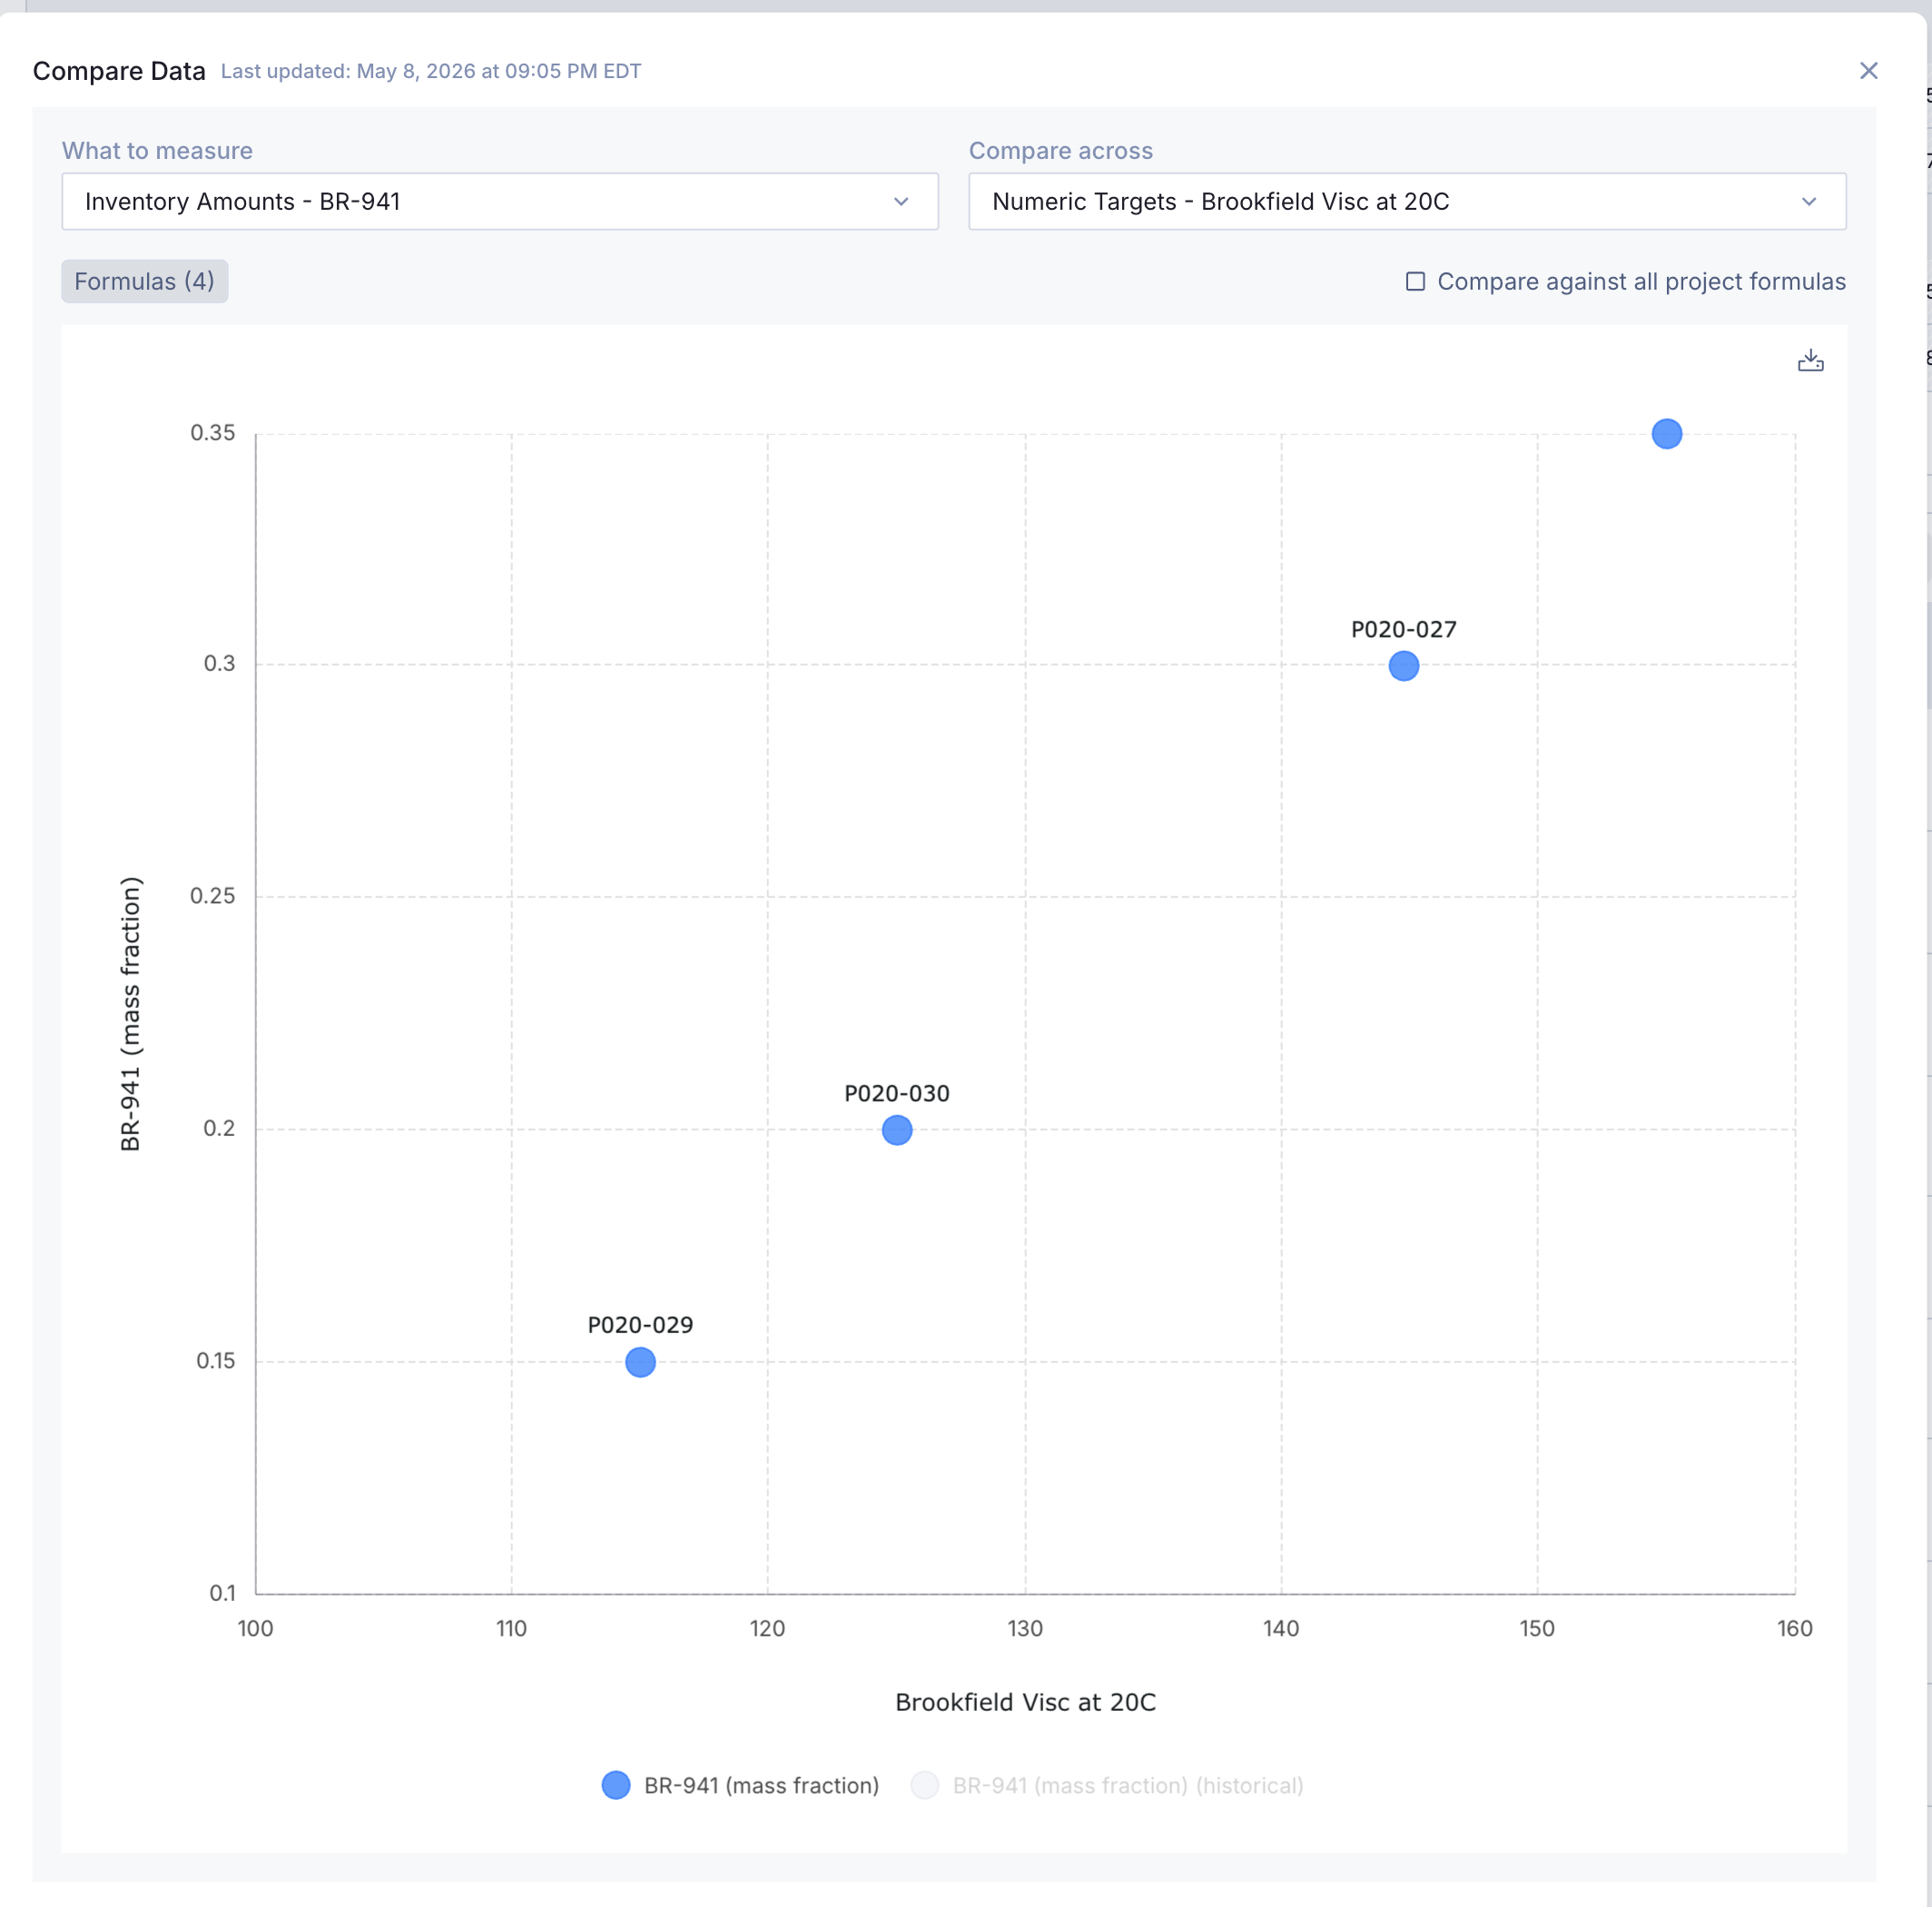
Inventory Amounts
This category lets you select any of your raw materials. Plot material concentration vs target result value, or concentration vs Formula ID!
Compare Across Options (X-Axis):
There are 5 categories of X Variables:
Formula ID
Show any of your Y values across formulas. This will always generate a bar chart.
Target Statistics
Show Number of Targets Met or Fraction of Targets Met on your X. Generates a scatter plot.
Numeric Targets
Have any of your targets on the X-axis. Always Generate a scatter plot.
Inventory Amounts
Select a Raw Material and see it's concentration across the X axis, generates a scatter plot.
Categorical Parameters
Select any other associated Parameter Group values on your X axis. Generates a bar chart. A great example here is when using substrate as a parameter, generate a result vs substrate chart.
Additional Chart Options:
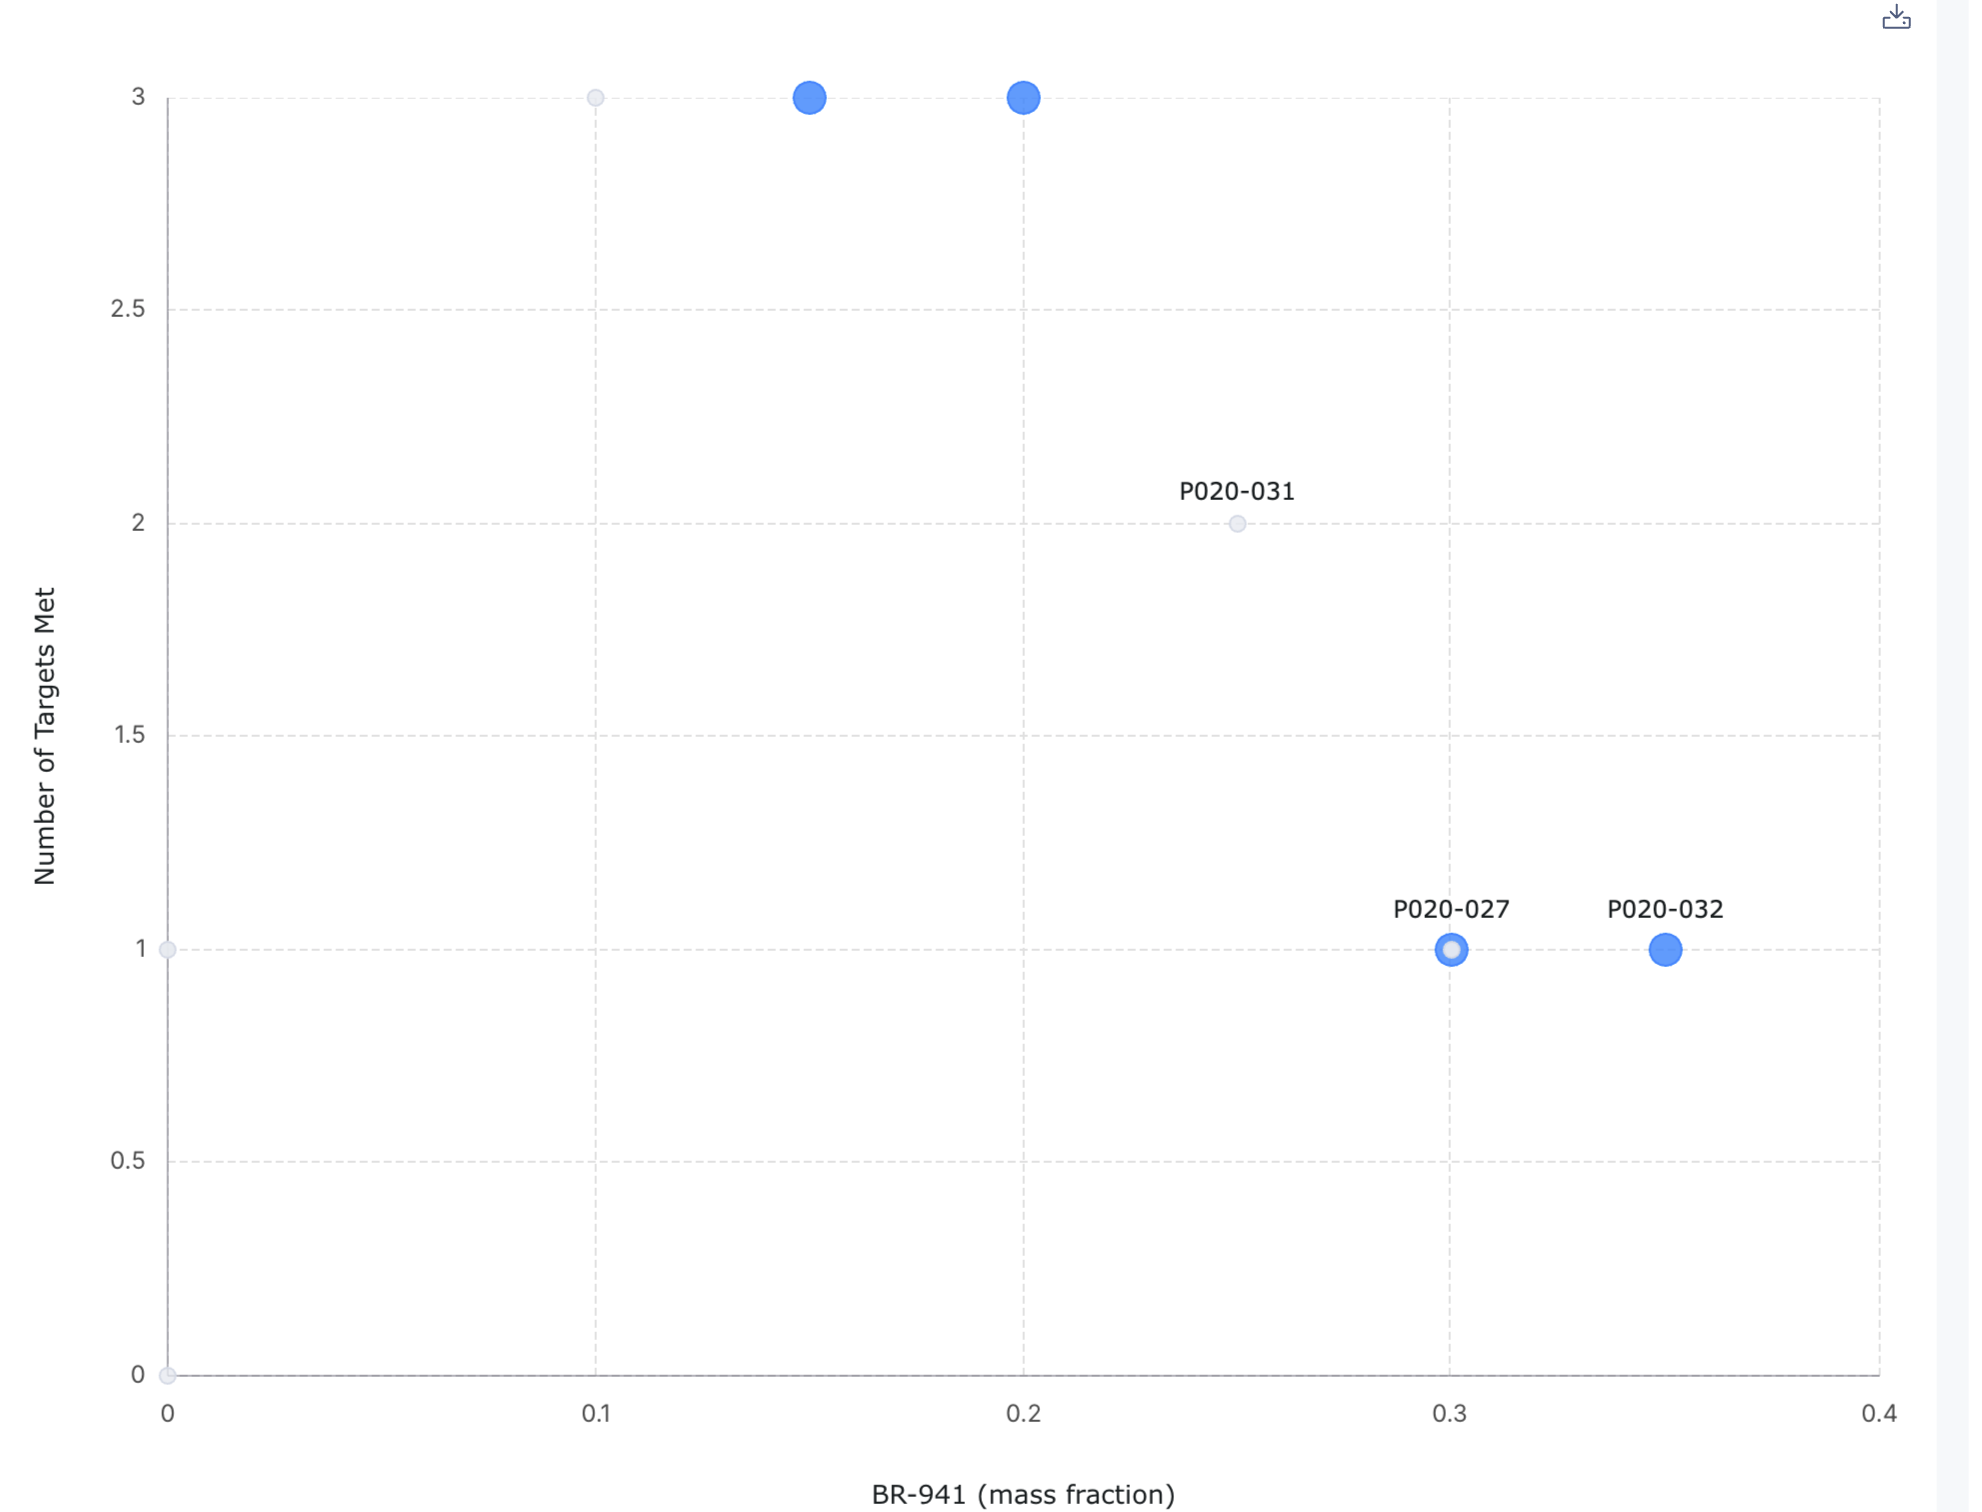
Include Additional formulas:
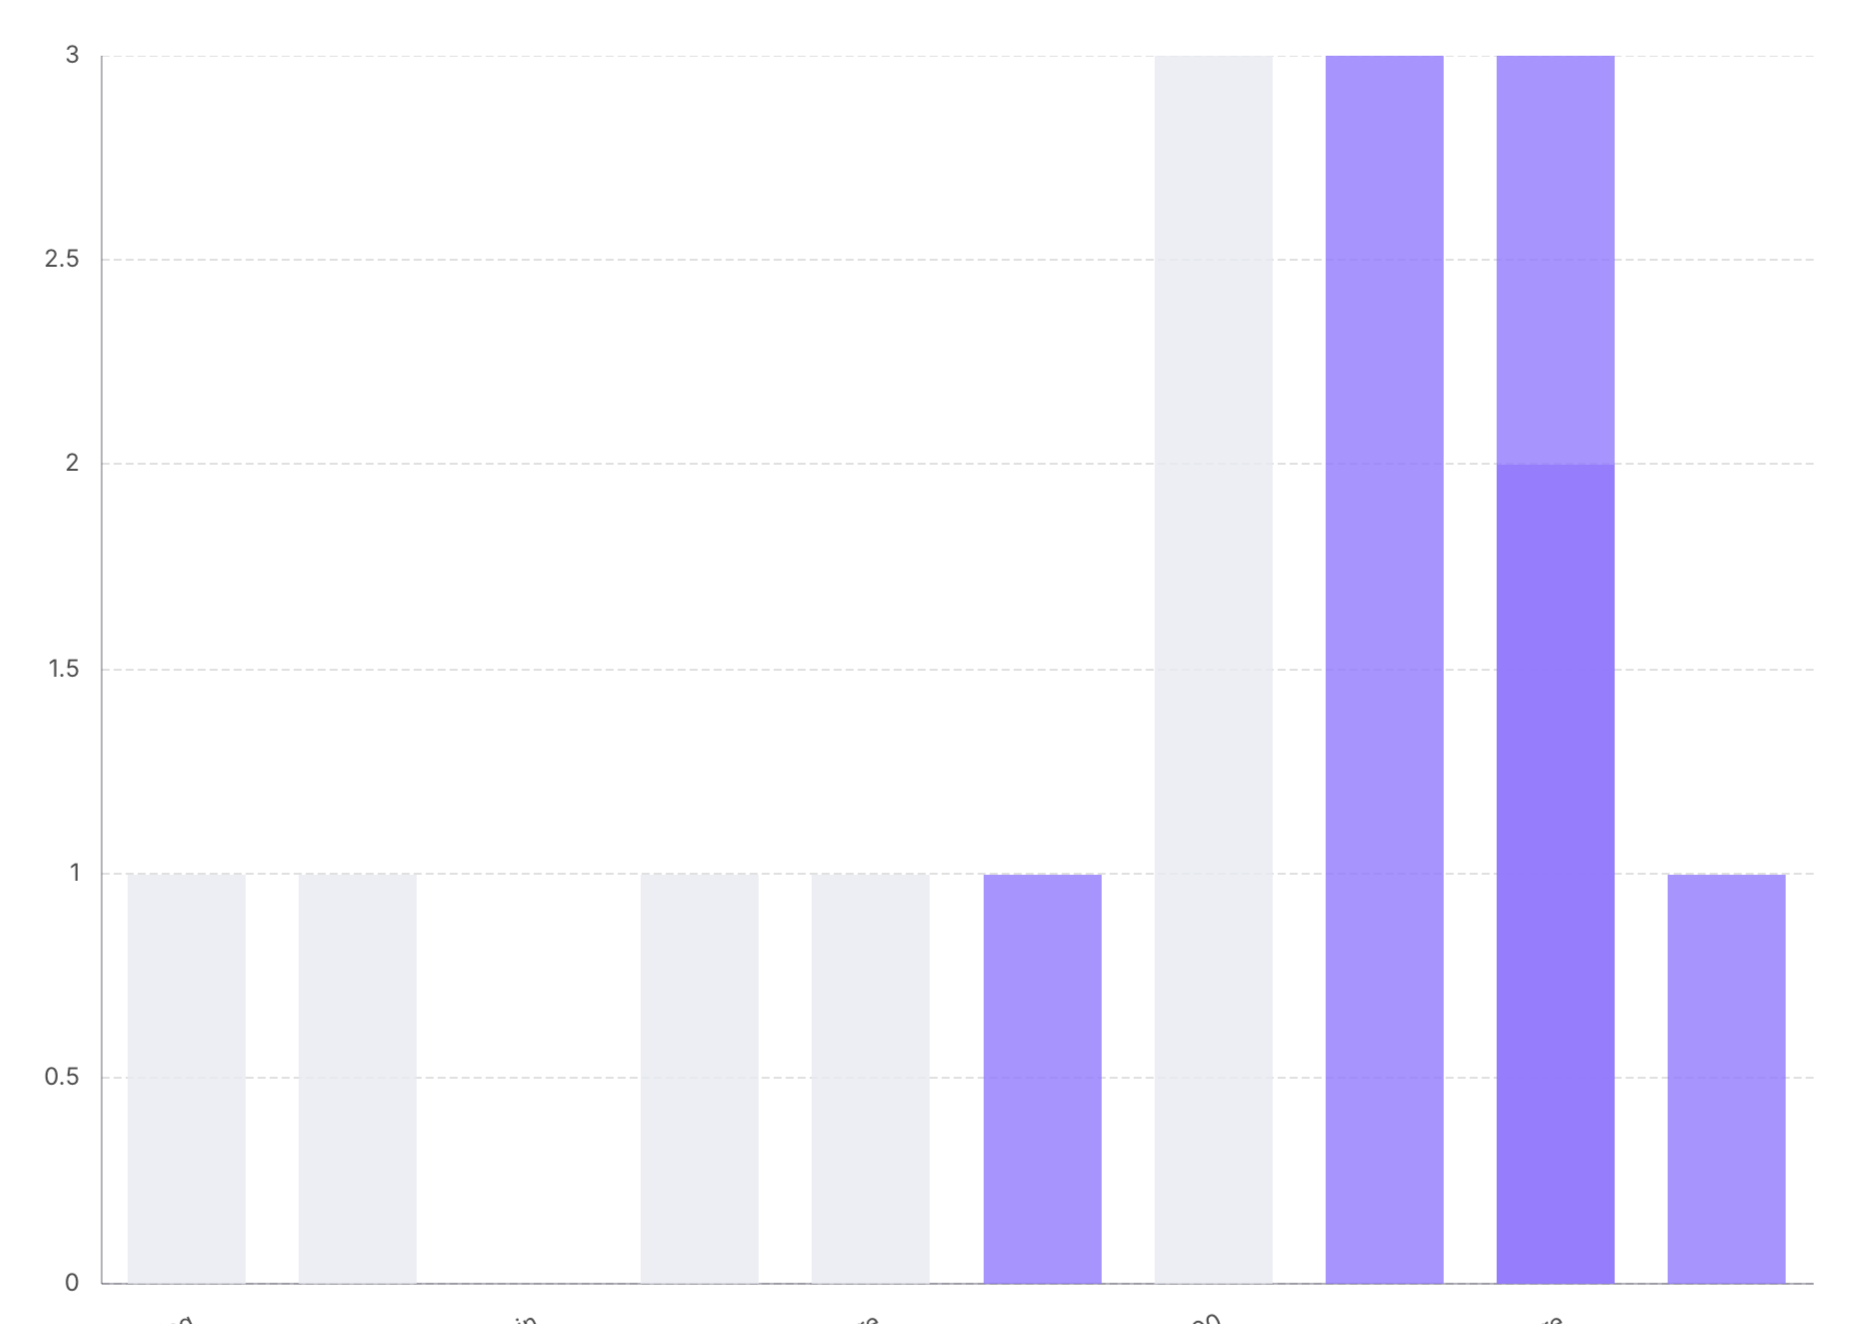
By Default, only the Formulas defined in the grid will show in your chart, as they are the formulas of focus at the time.
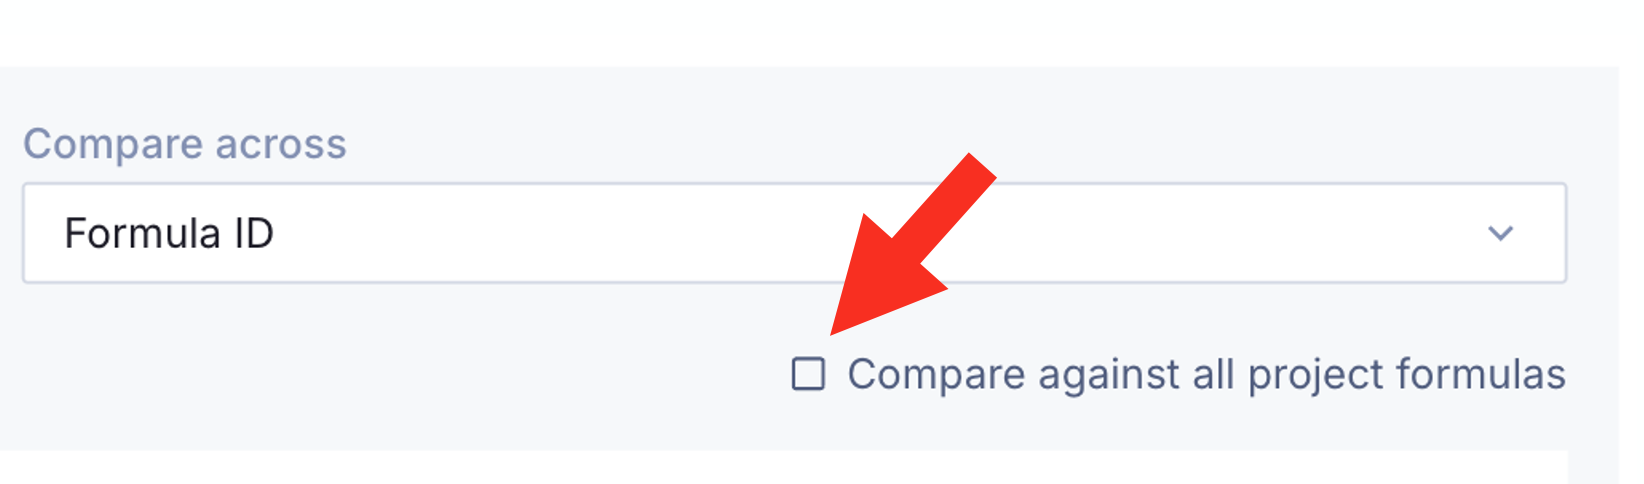
While creating a chart, you can easily show the values for other formulas by selecting the Compare against all project formulas button, and non-selected formulas will appear in grey.
Download or Copy Chart:
In the top right of the chart there is the download button. From here, there are three options:
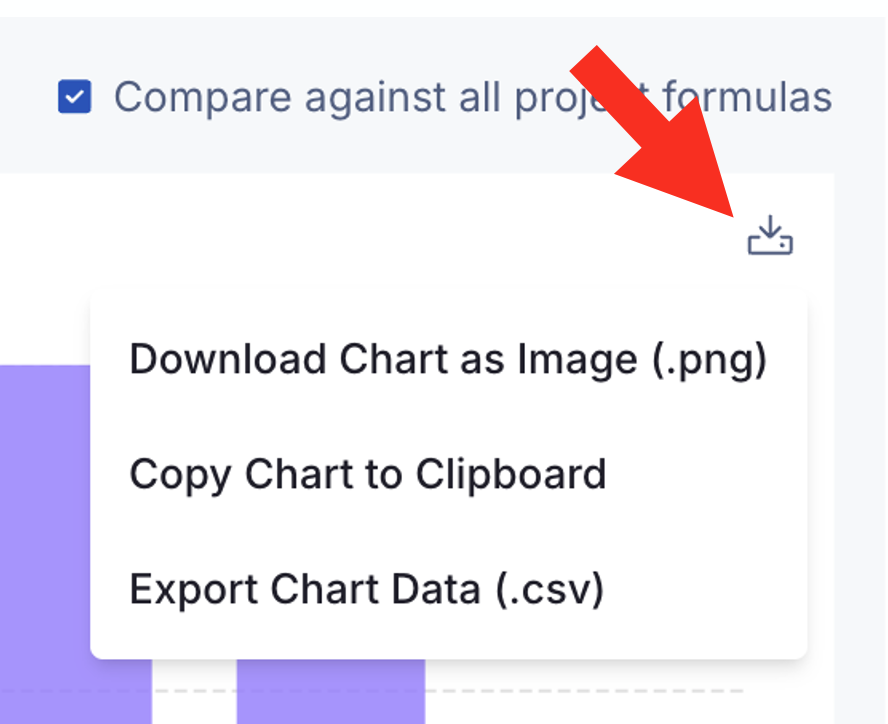
Download Chart as Image (.png)
Save an image file of the chart in the current state. Great for tracking over time, sending manager updates, or dropping in a written report.
Copy Chart to Clipboard
Copy the current chart state for easy pasting. Great to put in a Presentation or when sending a quick email.
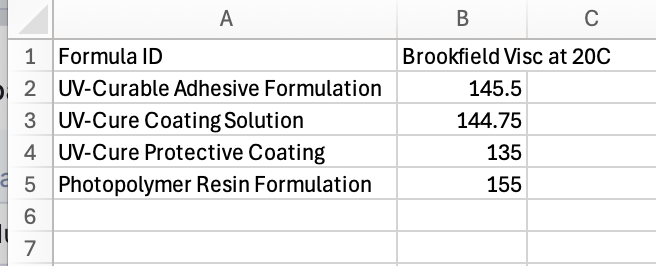
Export Chart Data (.csv)
Download the values the chart is created from as an Excel file. Great for quick data extraction or advanced visualization.
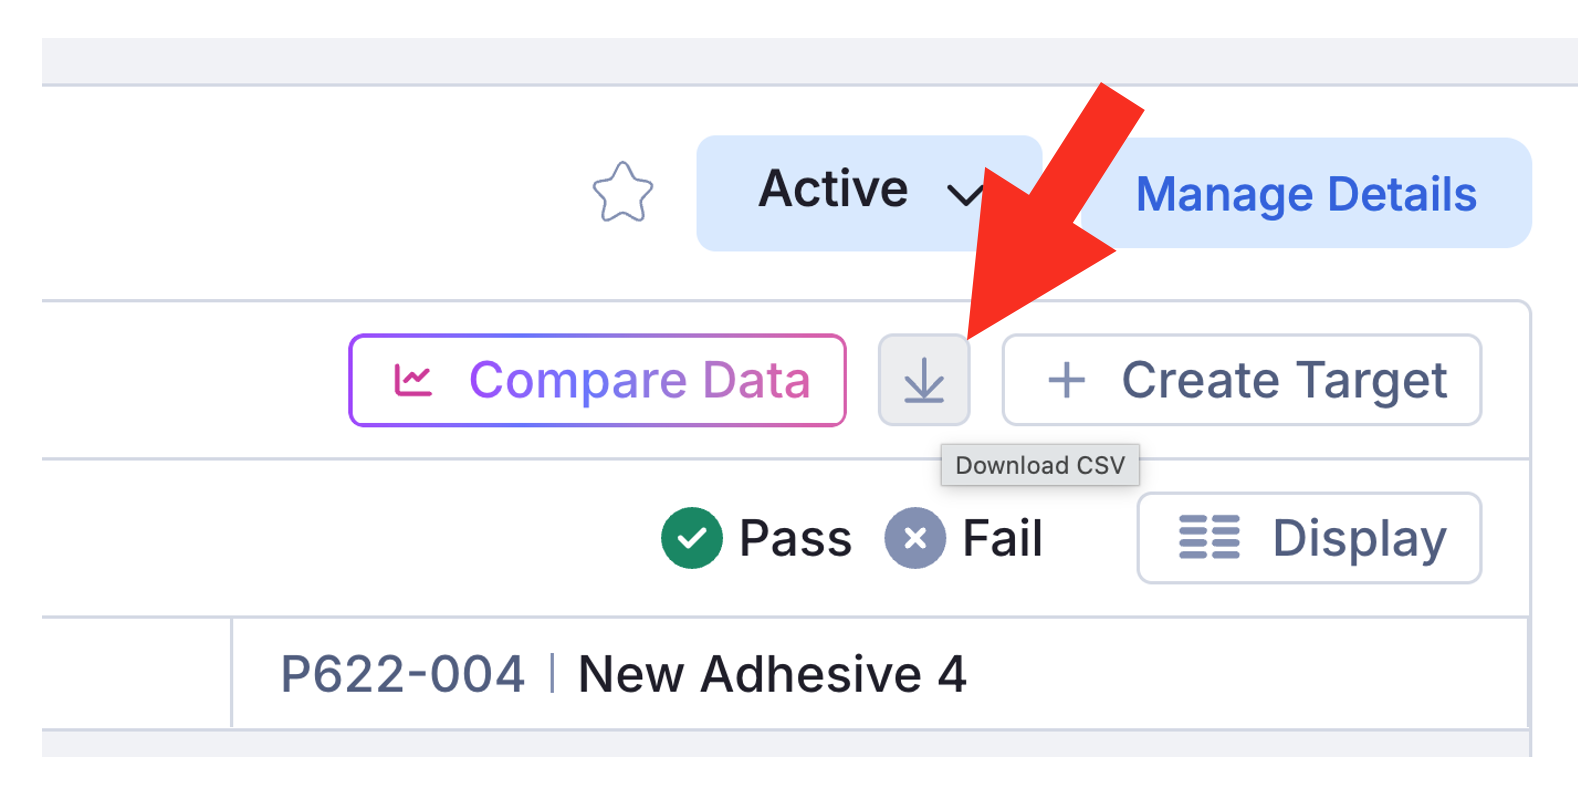
Download the Targets Grid:
At any time, you can download the current version of the grid to Excel. This is great for reports and for quick sharing outside of Albert.
Access Control Information:
The level of access and functions you can perform with Smart Projects will depend on your Role in the Project.
If you cannot see the grid, you should contact the Project Owners to ask them to raise your role.
Project Role: | View Target Grid | Create / Edit Targets | Sync Data | Compare Data |
Owner | ✅ | ✅ | ✅ | ✅ |
Editor | ✅ | ✅ | ✅ | ✅ |
Project Viewer, Task Editor | ✅ | ❌ | ❌ | ✅ |
View Only | ✅ | ❌ | ❌ | ✅ |
All Tasks Editor | ❌ | ❌ | ❌ | ❌ |
Property Tasks Editor | ❌ | ❌ | ❌ | ❌ |