
Data Template Script Automation
Albert allows you to upload Python scripts to your Data Templates for automatic ingestion of your raw instrument files into Property Tasks. This can be helpful for automating tasks like extracting key values of interest or uploading data tables into Albert.
By automating the process of extracting and structuring data from various instruments into predefined templates, this feature can significantly reduce the time and effort you spend on manual data entry. It ensures data accuracy and consistency, enabling you to focus more on analysis and less on administrative tasks, thus accelerating the pace of innovation and increasing the overall productivity in chemical R&D laboratories.
There are two example scenarios in which this feature could be helpful:
When you receive a GC report with a list of retention times and peak areas, you could extract that data into Albert and drop all of the other information
If you run a TGA and only want the starting weight, ending weight, and % weight loss without the entire plot of the curve, you could write a script to pull those specific values out into Albert
How does it work?
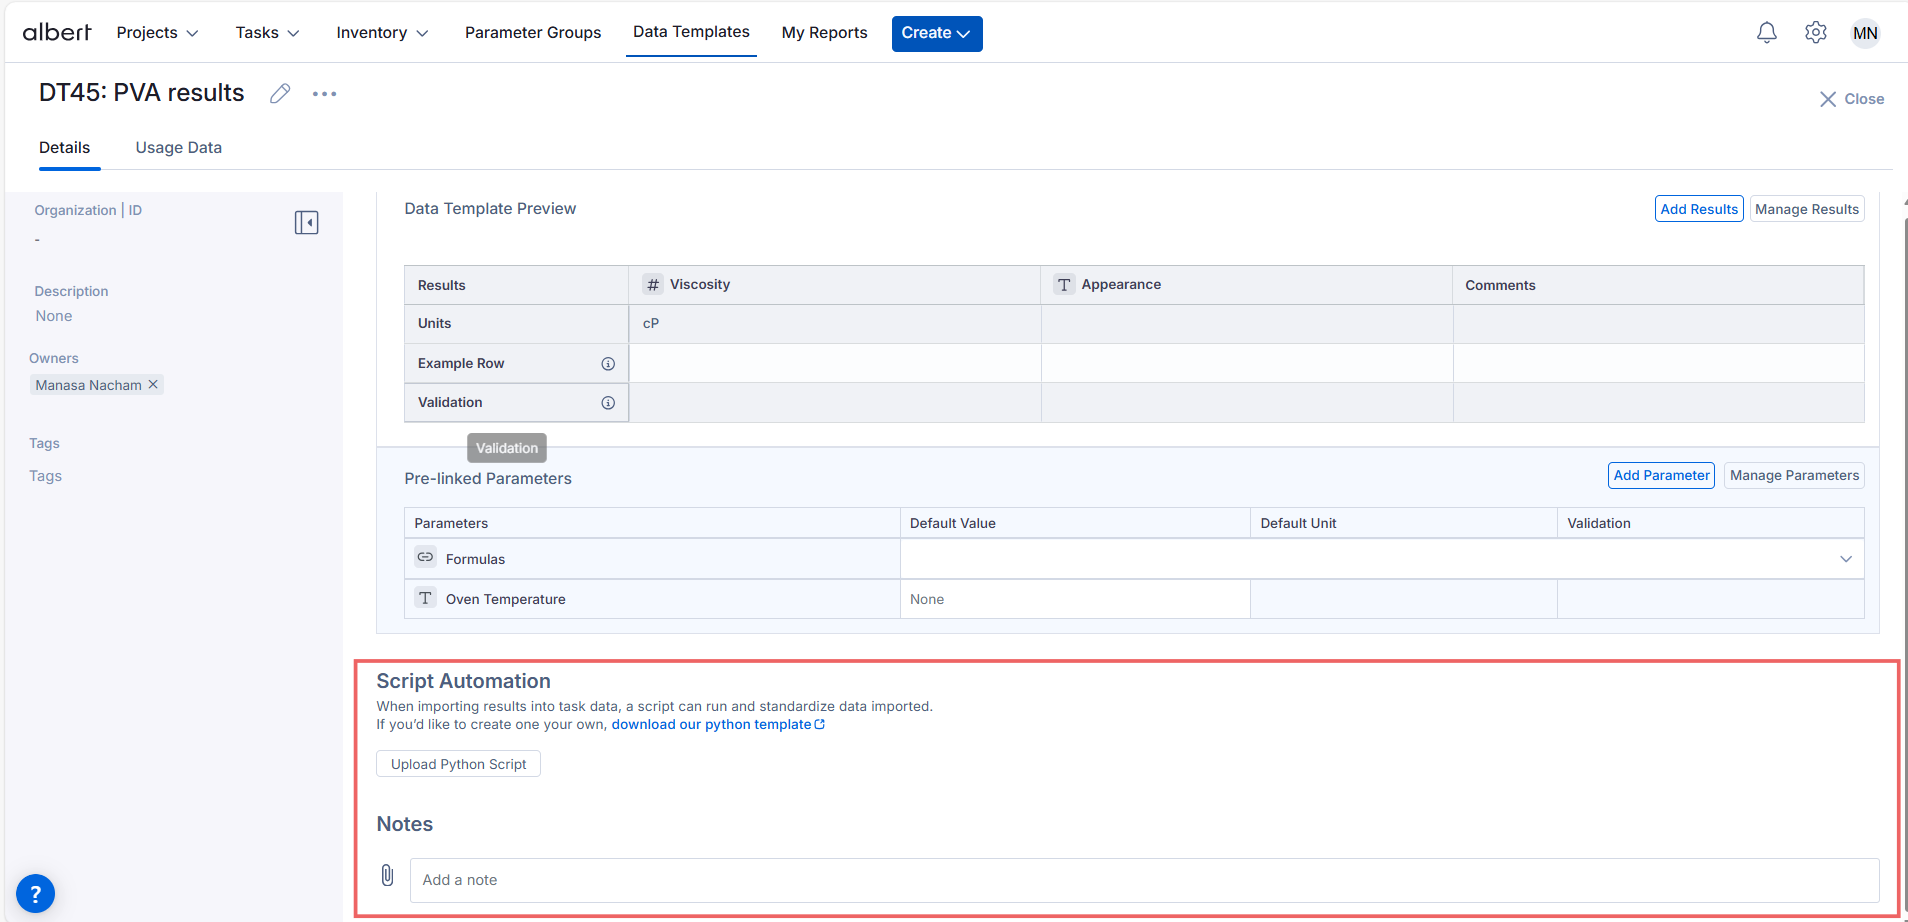
Inside your Data Template, you’ll see a Script Automation section and a button to “Upload Python Script”. In this section you can upload a script that will be available for use in all tasks.
This will open a workflow that allows you to upload your Python file, add a name and description, and indicate what file type the script supports.
Please Note: Only the following file types are supported at this time: csv, pdf, docx, txt, doc, xls, json, xlsx. For any unsupported file types please contact support@albertinvent.com for assistance.
After clicking “Attach Script," the Data Template will reload and display your Python script name in the Script Automation section.
Within a task, you will see an option for “Import Results”. This will allow you to access the scripts to automate the data import. (Note: if there are no scripts, you will use the default CSV Import flow that will do no transformation and simply allow you to map column names to the data template columns).

Once you select Import Results, you will see the scripts available for the data template. By selecting the script and your attachment, the script will execute on the attachment, transforming the data.

Once the data is transformed, just like you can with CSV import, you will map the data columns from the output to the data template result columns (Tip: in your transformation, have the output data match the naming of the result columns exactly to automate this step)
Important Considerations
A Python template file is available for download in the Script Automation section of every Data Template. This file provides the framework for the script to load the file and then send your results to Albert.
Your script should be written within the ETL function definition, resulting in the desired results saved as a dataframe named “df”. We recommend that you name the columns of your data frame to match the columns of the Data Template so that Albert can automatically match the two when importing the results.
Writing New Scripts
Looking to write a new script? This guide below will give you tips on how to generate scripts that will work most effectively.
To start, there is a script template that you can download directly from the product:

This template will include the base structure that is required to perform the data migration. Below are some examples of scripts that you may write:
Find the maximum point in a file
Calculate or aggregate data
Pull complex equipment outputs into a structured format
Map equipment names to the exact data template names to automate data import
Function Whitelist
The script is currently only allowed to call a subset of Python functions and 3rd party libraries. By default, we support a subset of numpy, pandas, and builtin Python functions. If you have new fuctions that you would like to be supported, you will need to submit a support ticket that will be reviewed by our technical teams. The following are the allowed “whitelist” keywords within an ETL script:
ALLOWED_FUNCTIONS = [
'sum', 'len', 'range', 'min', 'max', 'abs', 'all', 'any', 'filter', 'map',
'zip', 'bool', 'str', 'enumerate', 'sorted', 'round'
]
ALLOWED_METHODS = [
'strip', 'lower', 'upper', 'replace', 'split', 'append', 'extend', 'insert',
'remove', 'pop', 'clear', 'index', 'count', 'sort', 'reverse', 'get', 'keys',
'values', 'items', 'update', 'fillna', 'dropna', 'rename', 'groupby', 'pivot',
'mean', 'to_dict', 'apply', 'sort_values', 'merge', 'concat', 'drop_duplicates',
'melt', 'pivot_table', 'resample', 'replace', 'assign', 'copy', 'capitalize',
'casefold', 'startswith', 'endswith', 'find', 'rfind', 'partition', 'rpartition',
'join', 'reset_index', 'pivot_table', 'crosstab', 'cut', 'qcut', 'rolling',
'expanding', 'ewm', 'interpolate', 'astype', 'duplicated', 'drop', 'value_counts',
'mask', 'pivot', 'corr', 'cov', 'json_normalize','match'
]
ALLOWED_MODULE_FUNCTIONS = {
# Functions within the Pandas library
'pd': [
'read_csv', 'DataFrame', 'merge', 'concat', 'to_numeric'
],
# Methods on a Pandas DataFrame object
'pd.DataFrame': [
'apply', 'sort_values', 'to_dict', 'fillna',
'dropna', 'rename', 'groupby', 'pivot', 'mean',
'drop_duplicates', 'melt', 'pivot_table', 'resample', 'replace',
'assign', 'copy', 'reset_index', 'pivot_table', 'crosstab',
'cut', 'qcut', 'rolling', 'expanding', 'ewm', 'interpolate',
'astype', 'duplicated', 'drop', 'value_counts', 'mask',
'pivot', 'corr', 'cov', 'json_normalize'
],
# Functions within the Numpy library
'np': [
'sqrt', 'where', 'arange', 'linspace', 'logspace', 'random',
'array', 'zeros', 'ones', 'full', 'eye', 'sum', 'mean',
'median', 'std', 'var', 'max', 'min', 'dot', 'matmul',
'einsum', 'histogram', 'polyfit', 'polyval', 'fft','log'
],
# Functions within the Scipy library
'sp': [],
# Functions within the regex module
're': [
'compile', 'search', 'match', 'fullmatch', 'split', 'findall',
'finditer', 'sub', 'subn'
]
}
Need an Example?
Below is an example script. This script processes chemical reaction data from a CSV file, calculates specific chemical ratios, and identifies steady states in the data where certain conditions remain stable over time. It then groups these steady states for further analysis. Feel free to use this as a template as you create scripts of your own!
from io import BytesIO
import pandas as pd
import numpy as np
import re
from typing import Any, Union, Dict
from datetime import datetime
def ETL(task_data, data_buffer: BytesIO):
# Note how helper functions must be defined within the ETL method.
def _calculate_conversion_pct(row:pd.Series)->float:
mol_butane = row["Products: n-Butane Intensity (1460 cm-1)"]/row["FTIR n-butane absorption coefficient"]
mol_isobutane = row["Products: iso-Butane Intensity (1370 cm-1)"]/row["FTIR iso-butane absorption coefficient"]
total_frac = mol_butane + mol_isobutane
if total_frac == 0:
return 0
return round(mol_isobutane/total_frac,3)*100
def _calculate_syngas_ratios(row:pd.Series)->float:
t_flow = (row["Air Flow (SCFH)"]+row["Input: n-Butane (SCFH)"])
if t_flow == 0:
return 0
return row["Input: n-Butane (SCFH)"]/t_flow
# Read in the CSV into a data frame -- indicate that no column should be treated as an index
df = pd.read_csv(data_buffer, index_col=None)
df = df.dropna(thresh=2).copy()
df = df.dropna(thresh=2, axis=1).copy()
# Note how you cannot do df.replace(...)
df = pd.DataFrame.replace(df, "#NAME?", np.nan)
# note how you cannot do df.apply(...)
df["Isobutane Conversion %"] = pd.DataFrame.apply(df, _calculate_conversion_pct, axis = 1)
df["n-butane/air ratio"] = pd.DataFrame.apply(df, _calculate_syngas_ratios, axis = 1)
# Now calculate sumary stats:
def group_steady_states(df, columns, threshold=1, min_group_length=7) -> pd.DataFrame:
"""
Groups steady states in time series data where no column changes more than a specified threshold,
and only returns groups with at least the specified minimum length.
Parameters:
- df: pandas DataFrame containing the timeseries data. Must have a datetime index.
- columns: list of column headers to check for steady state.
- threshold: float, maximum allowable change in any column for it to be considered in the same group.
- min_group_length: int, minimum number of rows required for a steady state group to be valid.
Returns:
- List of DataFrames, each representing a steady state group with >= min_group_length.
"""
# List to hold steady state groups
steady_state_groups = []
current_group = [df.iloc[0]] # Start with the first row
for i in range(1, len(df)):
row = df.iloc[i]
prev_row = df.iloc[i-1]
# Check if all specified columns have not changed more than the threshold
if all(abs(row[col] - prev_row[col]) <= threshold for col in columns):
# If steady state, add the row to the current group
current_group.append(row)
else:
# Check if the current group is a valid steady state group
if len(current_group) >= min_group_length:
steady_state_groups.append(pd.DataFrame(current_group))
current_group = [row] # Start a new group
# Append the last group if it meets the steady state criteria
if len(current_group) >= min_group_length:
steady_state_groups.append(pd.DataFrame(current_group))
return steady_state_groups
col_for_steady_state = ["n-butane/air ratio", "Isobutane Conversion %"]
group_df = group_steady_states(df, col_for_steady_state)
return [
{
"Data": group_df, # Required
}
]
Permissions
Access Note: Only users with appropriate permissions can create or modify Data Templates through the API.
-> If you don’t have access to generate tokens or manage templates, please reach out to your Albert Administrator.