
Adding a Chart to your Report
Within a report, you can add charts to your data, allows you to create visual representations of your data. This article will walk through the available chart types, as well as our suite of features available for customization.
Adding a Chart:
Once your report has been created, you can add a chart to that report. You can use the Add Chart button at the top right of the report, as seen below.

After clicking on Add Chart you will be prompted to select your chart type.
Currently, there are 12 chart types available:
Bar
Line
Pie
Donut
Scatter
Bubble
Area
Box*
Histogram
Heat Map
Radar
Combination
Note: Box plots are only available if you using non-pivoted data - data does not have "group rows by" or "breakdown columns by" under the Edit Table tab.

Defining Your Chart:
Chart Style:
If you want to change the type of chart you're using, you can easily swap to another style.
Axes:
X-Axis / Category:
Define which column will be your X-Axis labels.
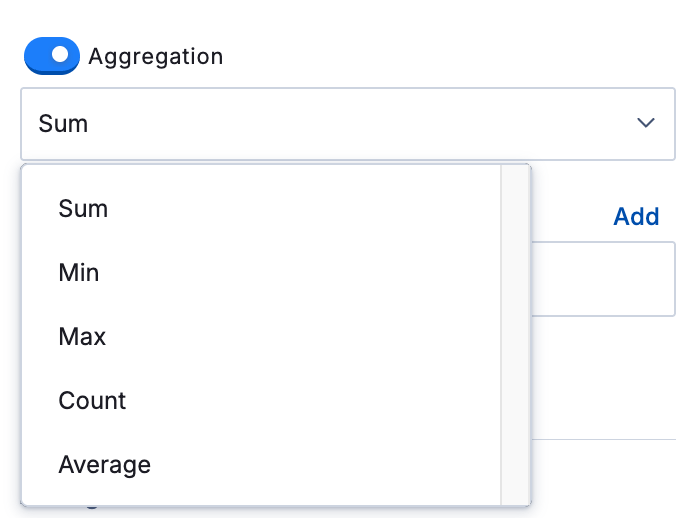
Aggregation:
Only available when using non-pivoted data. Allows you to still graph averages, sum, min, max, and count without needing to aggregate your columns.
Y-Axis / Series:
Determine what you want to use as your values on your graph. You can add multiple by using the "add" button. Each one added will appear in different colors, making comparison easy.
Secondary Y-Axis:
Available on some chart types. Allows you to have a second Y-axis scale. Great for comparing data that may have differing orders of magnitude.
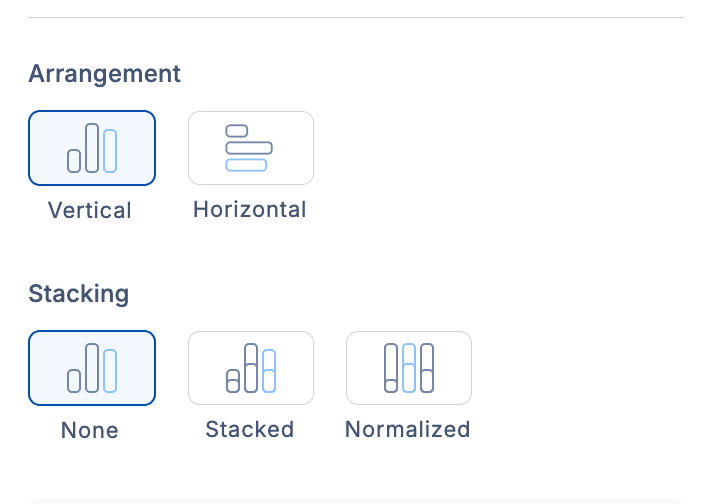
Arrangement & Stacking:
Some chart types may have options for arrangement and stacking. These are alternate options to change the visual representation or normalize the data.
Goal Line:
You also have the option to add a goal line or range to your data. Depending on chart type, you can set this as vertical or horizontal, and define where on the axis you want the line to be.
You can also add a start and end value, turning it into a range. You can change what the line looks like, and even add a label to that line/ range.
Also, you can even have more than one goal line!
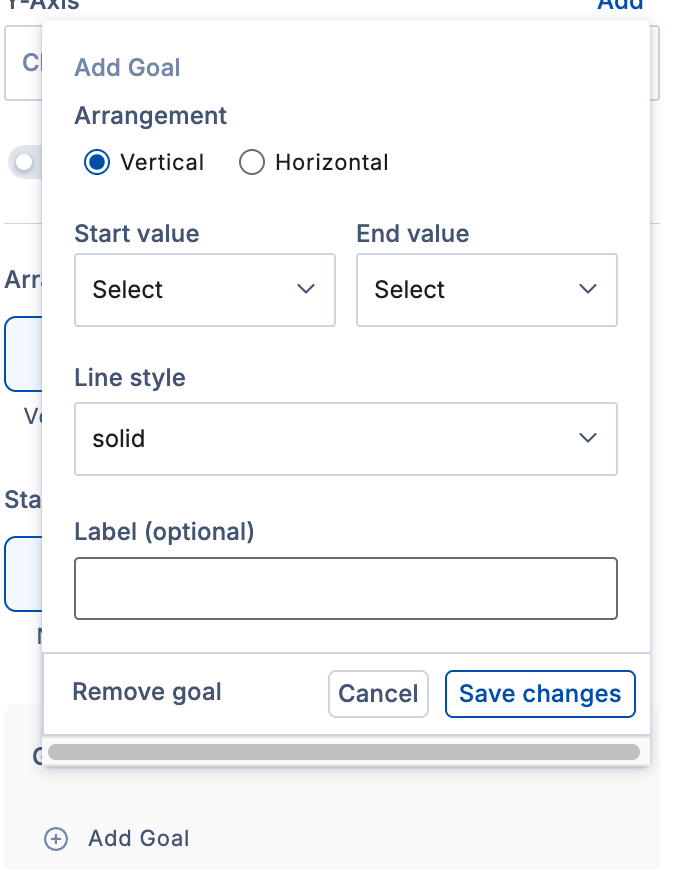
Chart Display Options:
The Chart Display tab gives you cosmetic and customization options to make your chart more understandable.
Theme
Theme allows you to change the colors of your chart.
Note: If you are interested in a custom color scheme for your organization, please contact your Delivery or Customer Success Manager or submit a support ticket. Note that any changes must be approved by an organization Admin.
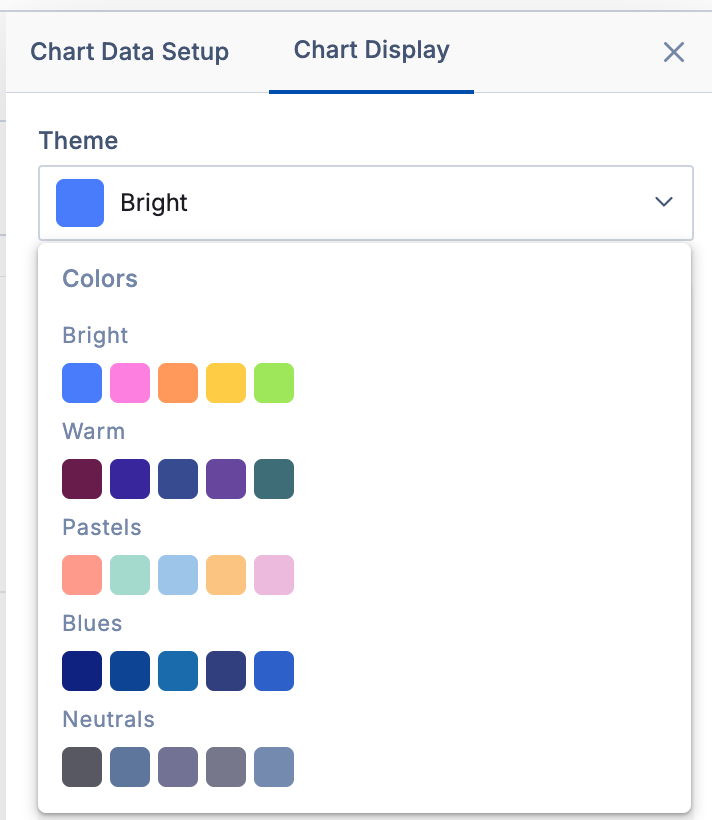
Chart & Axis Titles
This section allows you to add text around your chart. You can add a Chart Title, X-Axis Title, Y-Axis Title, Secondary X-Axis Title (iff applicable), Subtitles, and Footer Text.

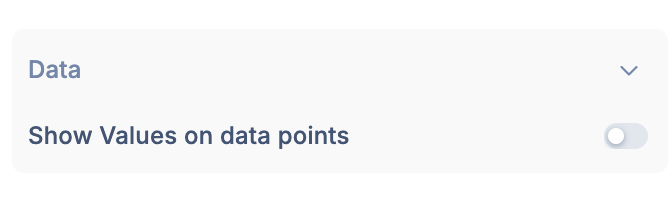
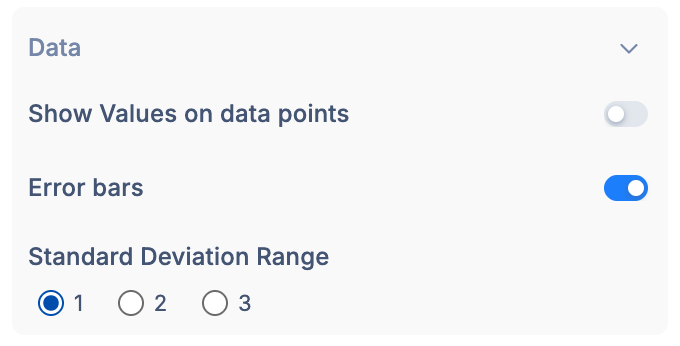
Data
This section allows you to toggle "Show values on data points." This makes it so the points on your graph will be labeled with their exact values.

The other option under Data is Error Bars. You can choose the number of standard deviations that your error bars include, from 1 to 3. This is also how you can graph the Avg +- Std aggregation type.
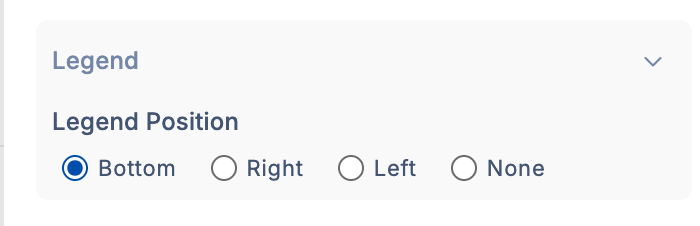
Legend
This section lets you determine where you would like your legend to be in relation to your chart, or disable it entirely. By default, if you only have one Y-axis, it will be disabled.
Axis:
This section contains your axis options.
Grid-lines:
Enable or disable grid lines. For some chart types, you can control X and Y axis grid-lines independently.
Label Angle:
Control the angle of your axis labels, X or Y. Turn your labels vertical, horizontal, or angle them. Auto will determine the recommended angle based on your chart. If you have lots of data points, then vertical may be best; horizontal may be better with fewer data points.
Log Scale:
Enable logarithmic scaling for the X or Y axis.
Axis Range:
Will auto-scale based on your data by default. Can be toggled off so you can manually enter your axis range. Based on chart type, you may also be able to set for X axis, or second Y Axis.
Step Size:
This will also be set to auto-scale by default. Can be toggled off and you can manually set you axis increments. Based on chart type, you may also be able to set for X axis, or second Y axis.
Label Angle:
Allows you to control the angle of your axis labels. Is available for X and Y Axes, depending on chart type. The default will be Auto. This will dynamically recommend an angle based on your chart. You can manually turn your labels horizontally, or vertically depending on your needs and cosmetic choices.

Advanced Settings:
Navigator:
The navigator allows you to control the zoom on your chart. By enabling, you will see a bar appear at the bottom of your chart.

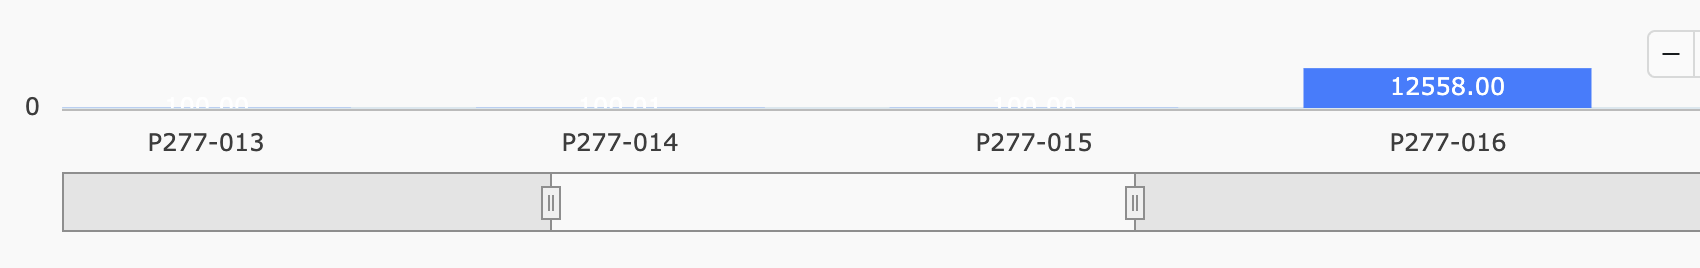
You can resize this area and scroll left and right. As you make it narrower, the chart will Zoom in. This can be helpful if you only want to visualize some parts of your data at a time. Additionally, it can make very large charts more readable by reducing the visual range, and scrolling from side-to-side as needed.
Exporting Your Chart:
Once you've completed your chart, you can export it for use elsewhere. This will save your chart as a picture, so it can easily be pasted into a presentation, report, or even an e-mail.
You can select the ellipses (...) at the top-right of your chart, next to Edit Table and select "Download Chart."
Additionally, you can right-click on your chart and select Download Chart or Copy Chart*. Copying chart makes it so you can easily paste with ctrl+v anywhere on your computer.
Note: Copy chart is currently disabled for Safari but other browsers, including Chrome and Edge, work without issue.

If you download your chart, you may notice a grey background. There is no need to worry, as the background is actually transparent. This means that it will match the background of wherever you insert it. So in a white Word document, the background would be white. In a green PowerPoint, the background would be green; it always blends in.