
Creating a Pivot Table
Pivot tables efficiently summarize large datasets by grouping, filtering, and aggregating data to reveal insights through interactive and dynamic views. They simplify analysis, enable custom reporting, and support quick data exploration without altering the original dataset.
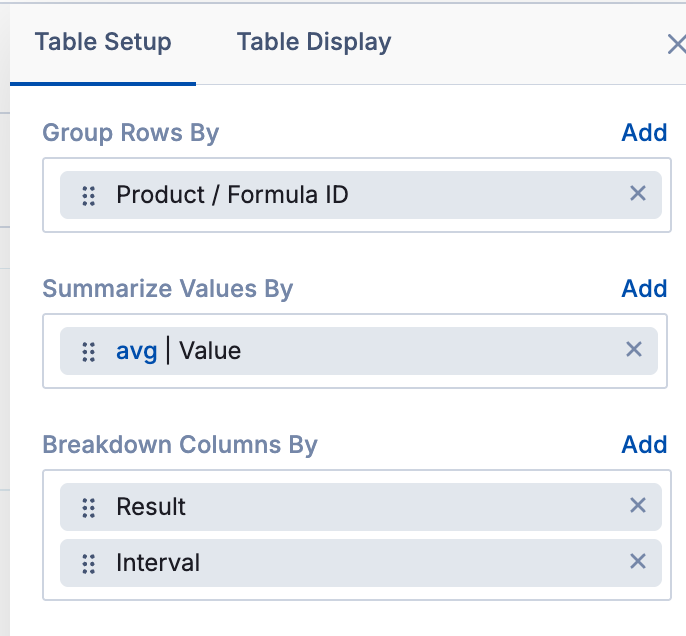
Pivot options are found at the top of the Table Setup Tab, under Edit Table.

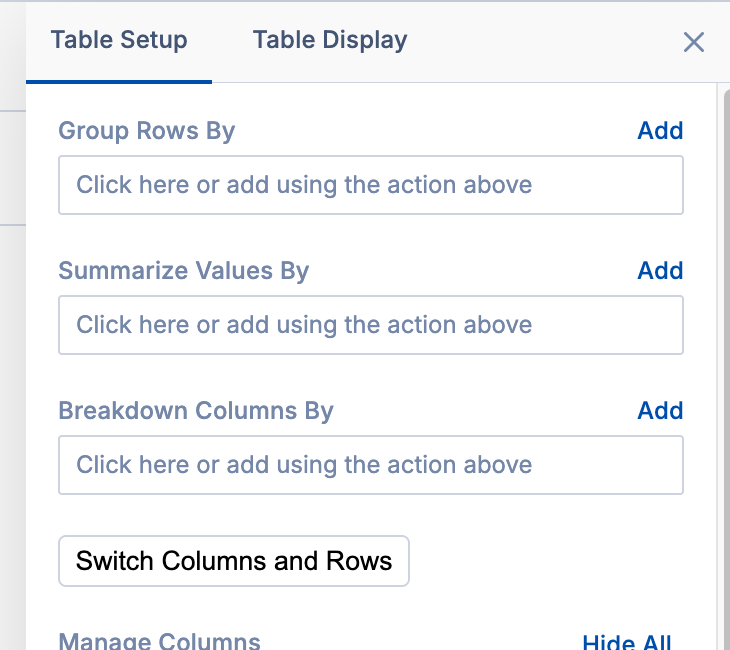
You have three options, Group Rows By, Summarize Values By, and Breakdown Columns By. There is also the option to switch Columns and Rows.
Group Rows by
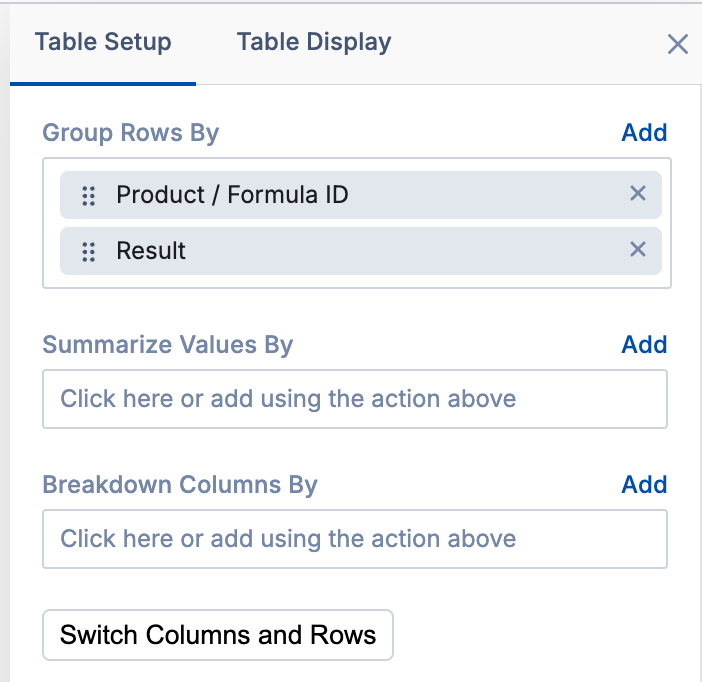
This option allows you to group your data based on your set criteria. Multiple groupings can be added, allowing you to layer and structure your data as needed. You can re-order your groupings as needed, they will follow a top -> bottom approach.
For instance, you could first group by Formula Name and then by Result — this way, you’ll see data grouped by formula, and within each compound, broken down further by each condition it was tested under, giving you a clear and structured view of your data.

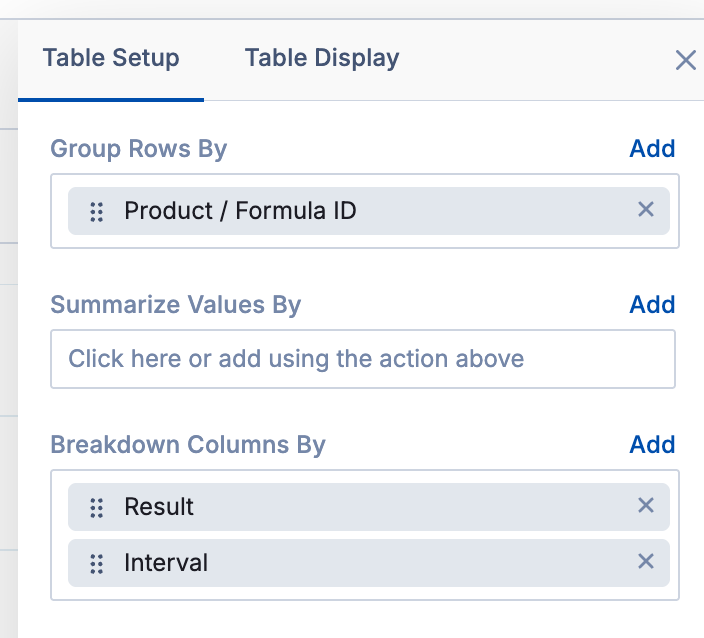
Breakdown Columns by
This option allows you to set new columns for your report. These will replace the existing columns of the report. One row will be created for each unique value based on the criteria you set. For example, if you select Formula ID, each formula ID will get its own column.
Just like with group rows by, you can multiple entries. A common example here is to add your result types as columns, and then add intervals.
Summarize Values by
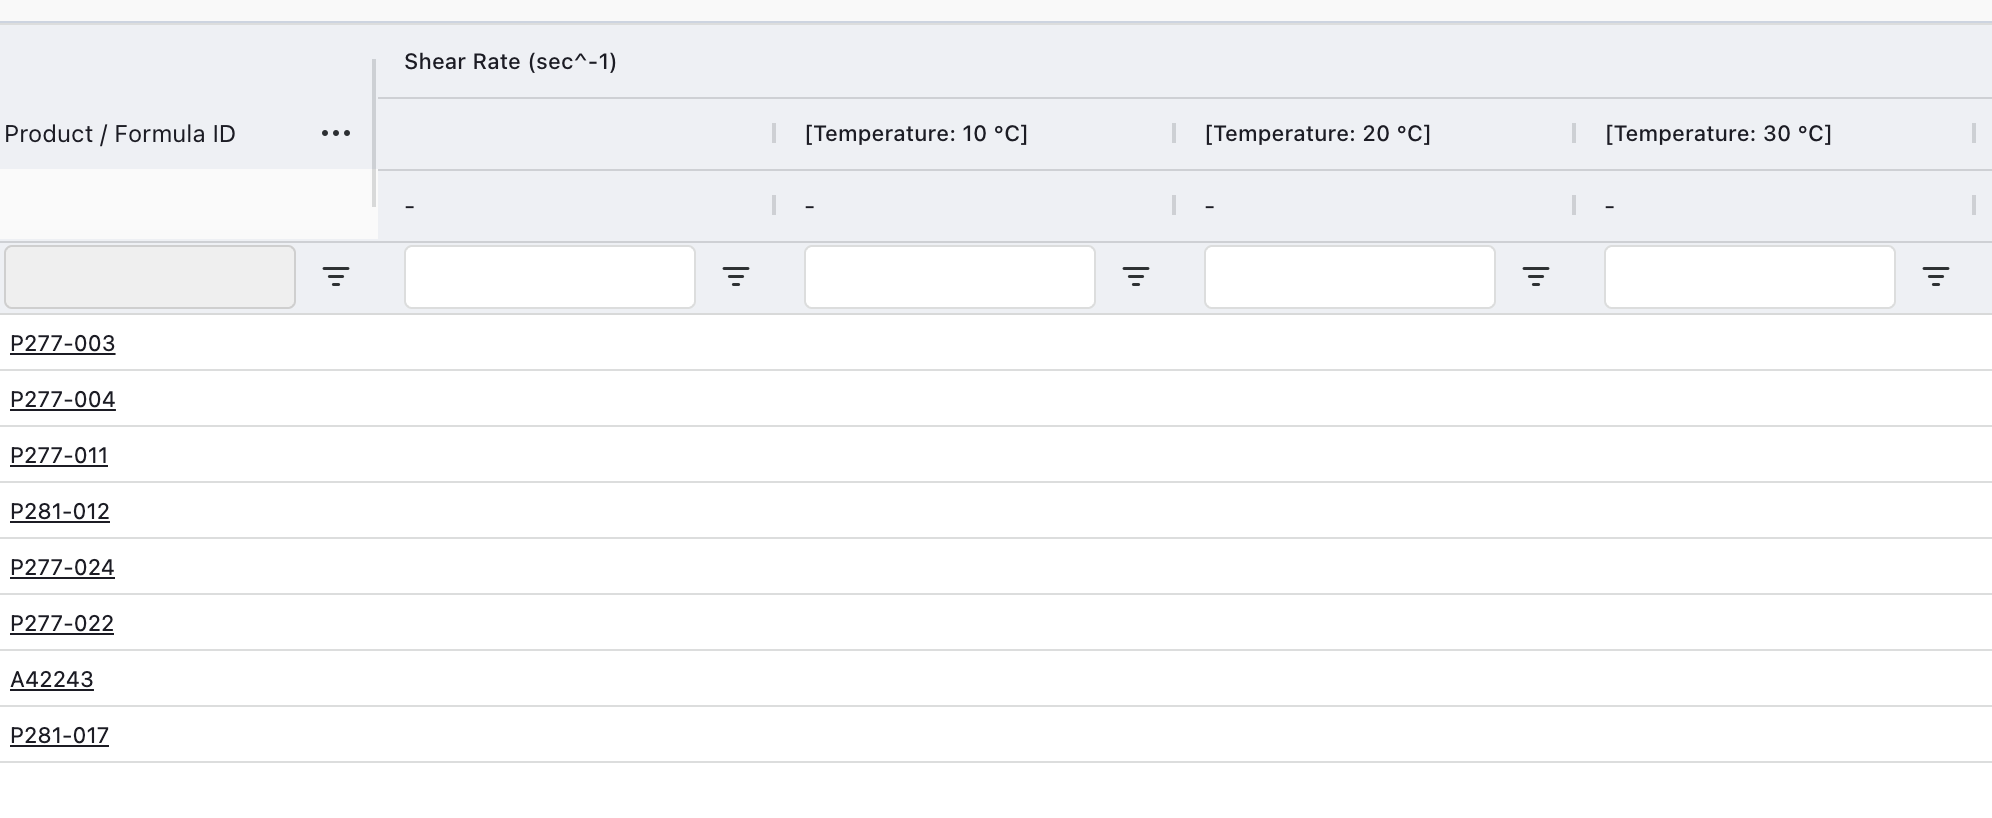
When using both Group Rows by and Breakdown Columns by, you will notice that your chart will appear blank. You will have to define what data should be shown where the two definitions meet.
You have several options. The most common, especially with result data will be Value. Value just means your data points that were captured in tasks. There is also Value (copy) which functions the same as value, but gives you additional options to see a different data aggregation. See the section below for more information about aggregation.
Aggregation:
When using a pivot table, your data points that meet you row and column definition will be aggregated together. By default, this data will be averaged or counted, depending on data type. By clicking on the blue text, you can change your data aggregation option. The following options are currently available:
Avg - reports average value (numerical)
Std - reports standard deviation (numerical)
Sum - Adds all values together (numerical)
Min - Reports the lowest value (numerical)
Max - Report the highest value (numerical)
First - Report the value that was entered first (numerical or text)
Last - Report the value that was entered last (numerical or text)
Count - Report the number of values (numerical or text)
Concat - Report list of all values, separated by commas (text or numerical)
Avg/Concat - Based on the data type, return either average (number) or a list of values (text)
Avg +- Std - Report your average and standard deviation in a single column (numerical).
Use Cases:
You want to see your average values as well as your peak values. You can use both Value and Value (copy) selections under Summarize Values by. You can then set the Value aggregation to Avg to show your average values, and set the Value (copy) aggregation to Max. You will then see a column of averages, and a column of peak values for each result type.
You want to see the number of inventory materials expiring in each storage location. You can use Group Row By for you expiration date months, and Breakdown Columns by for your storage locations. Then for Summarize Values by you can select "Inventory IDs" and change the aggregation method to "Count." This will count the number of unique inventory IDs that will be expiring in that storage location, during the given month.
Switch Rows and Columns:
This button will swap your current Group Rows by and Breakdown Columns by definitions while maintaining the order and any filters that may be applied.
Tips and Tricks:
Set Columns First:
It is recommended that when setting your pivots, try and set your columns first. If you are planning to add a chart, it is recommended that what you are comparing be set in your columns. So, if you are comparing one formulation to another, then your formulas should be your columns. However, if you are comparing how one result value vs another result type, then your formulas should be in the rows, with your results being in the columns.
You can always use the Switch button to swap your column and row definitions later if needed!
Group Ordering:
The order of your groups does matter. If you ever need to re-arrange them, you can easily click and drag to change the ordering. A good rule of thumb is that each group should be more specific than the last. For example, Type -> Data Template / Parameter Group Name -> Result / Parameter. This way, your data stays concise and free of any duplicates.
However, you can use multiple groupings of the same level. For example, you can use both Formula Name and Formula ID to see both at the top of each column.
Result
You will see Result in most reports types concerning experimental data. This may be confusing at first, but Result means data column or parameter. So, think of each individual column on your data template as a result type. So, you can use result to display those individual columns (or parameters in some reports!)
Still Confused?
If this is still overwhelming, many report types come pre-pivotted. This can take a lot of the stress of setting pivots away. However, if you still need help, please submit a support ticket or email Support@albertinvent.com and we're more than happy to assist you!