Filtering A Report
When using Reports, you can apply filters in several places. This allows you to hide unwanted data and further refine your report. These filters can be combined, providing limitless options for report customization.
Pre-Filters
You can start filtering your data before you even create your report. After you select your report template (by answering the first two questions, "What do you want to report on?" and "What do you want to analyze?" as shown below), you will next be prompted with the question, "How do you want to filter your data set?" Albert recommends filters based on the report template you select when asked this question. From here, you can control exactly what data will be included in your report.
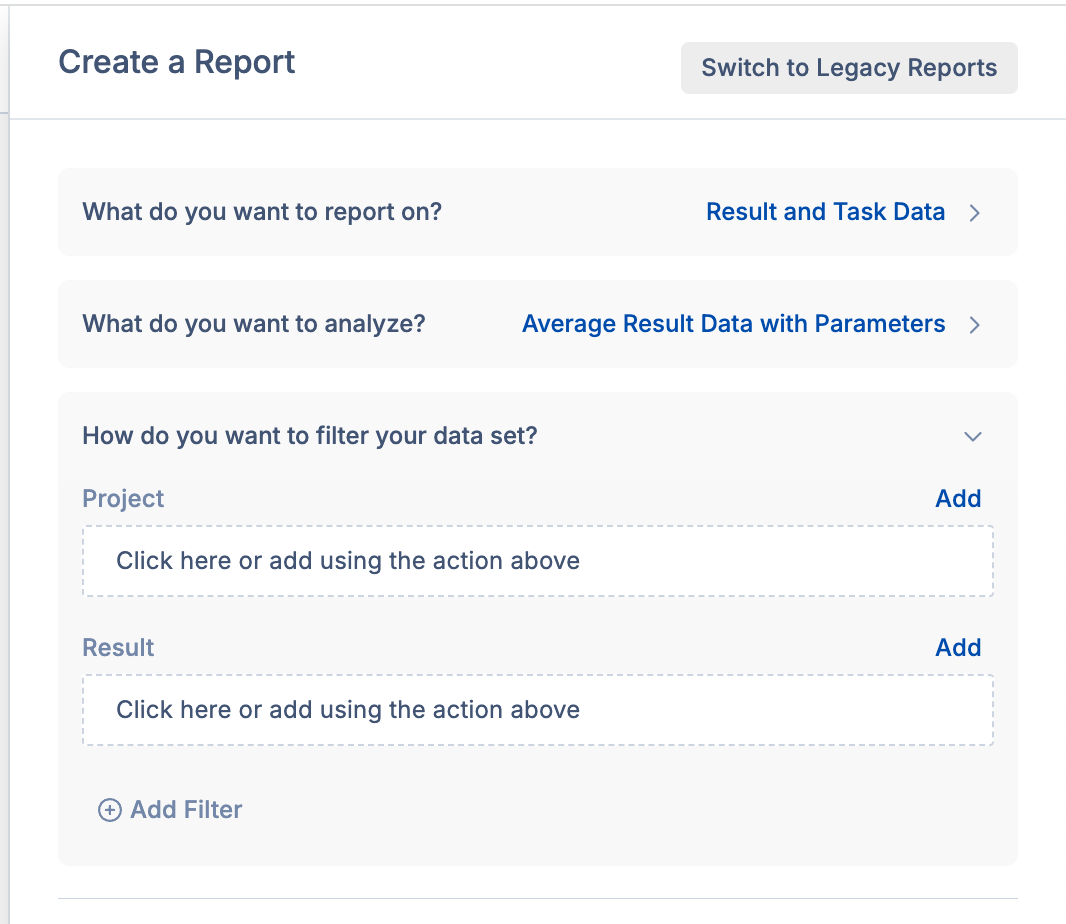
In the above image example, Albert gives options to filter based on the Project and/or Result. There is also the Add Filter button at the bottom left. Here is where you can add additional filter types for further control of your data.
Mixing and Matching:
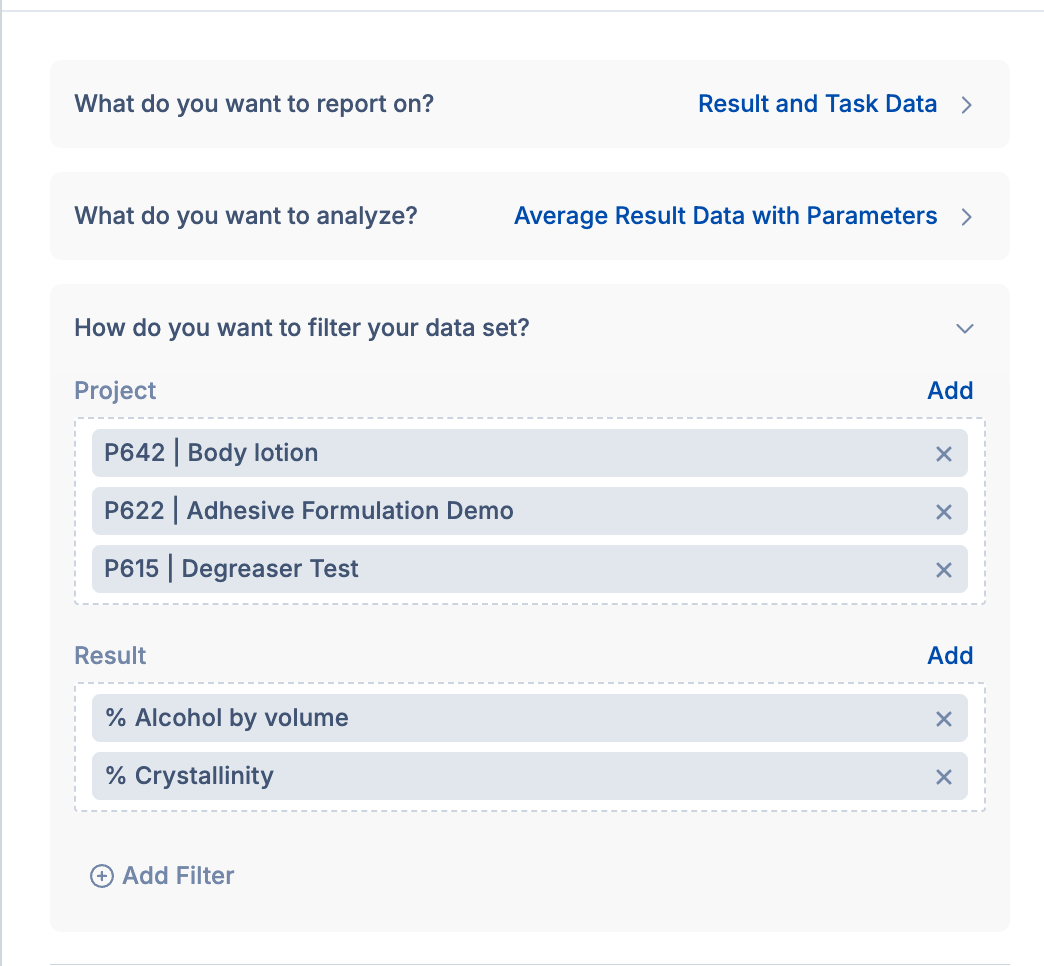
You can add multiple items to one filter. In the below image, by adding three projects to the Project filter, you will now bring the property task results from all three projects into the report.

You can also add more than one filter at a time. In the below example, values were added to Project filter and the Result filter. This now means that all % Alcohol by volume and % Crystallinity results from the three projects listed are the only results that will be pulled into the project.
This removes any other Results that are not specifically these values, allowing you to pull in only the values you are most interested in.
Combining these pre-filters is a great way to make the reporting process easier! If you only pull in the information you need, there will be less work required once the report has been created to get it in a format that is useful to you.
Table Filters
Once your report has been created, you have options for further filtering. The first option is Table Filters. There will be a filter available for each column. These filters apply to the raw data, allowing you to filter that raw data even when the data has been aggregated.
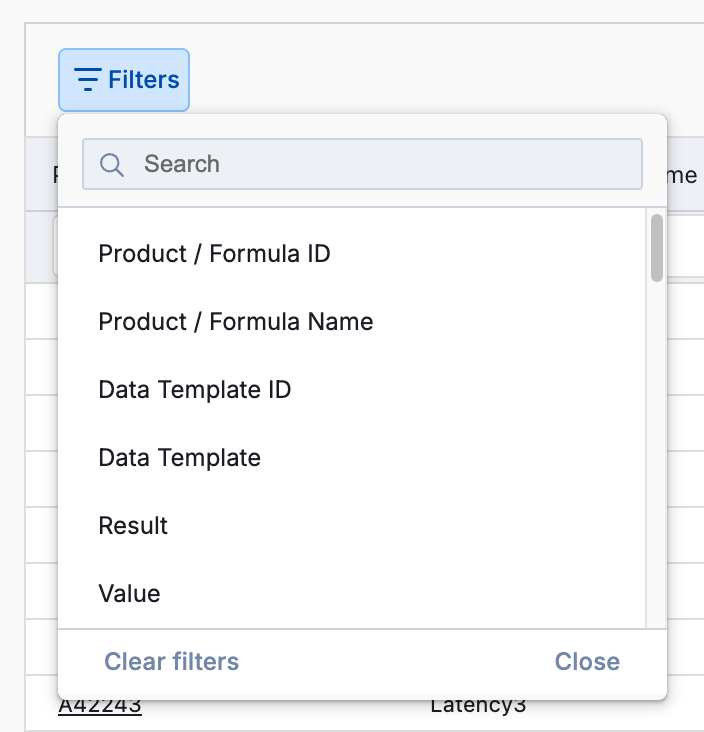
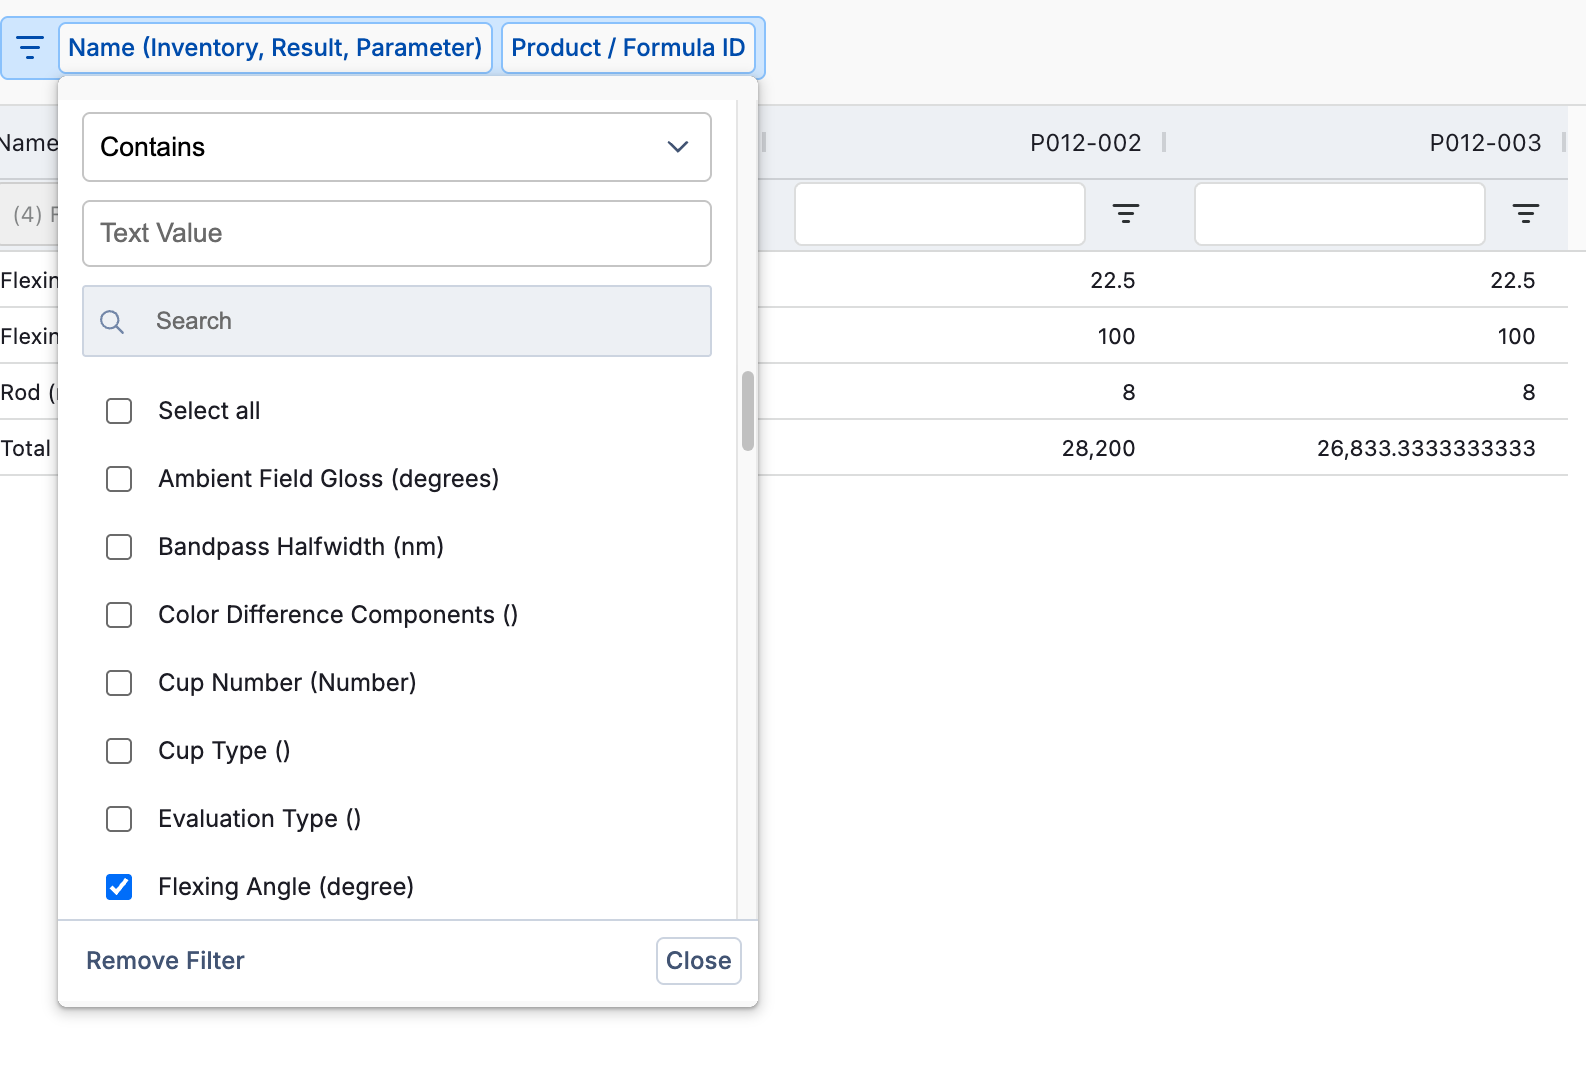
After you select the column you would like to filter, that column's filtering options will show up.
As you can see in the lower portion of the image, you can use the checkboxes to turn off/on different values. For example, if you are only interested in some formulas, you can turn off the ones you are not interested in. There is a Select All option, as well as search bar, making it very efficient to find and toggle different values.
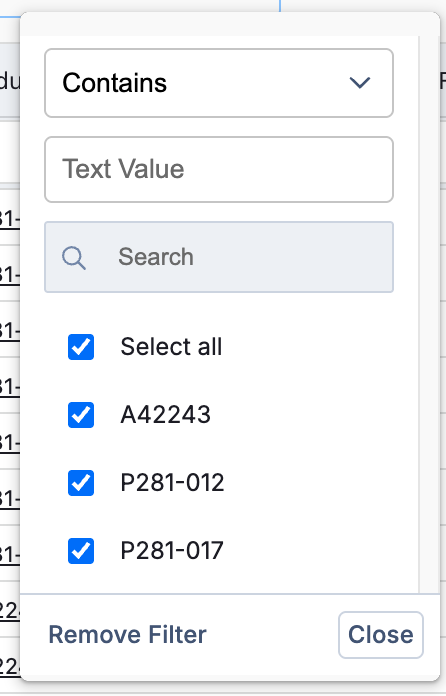
In the top portion of the image (above the search bar), you can set custom criteria to filter your data.

Based on your data type (text, numerical, or date), you will have different options. Common options include:
Contains - Great for storage locations. If you are in Lab 200, but have storage locations like Lab 200 Shelf, Lab 200 Fridge, etc. you can use contains to show all options that contain the text you type
Greater Than - Only available for numeric data. Commonly used as Greater than 0 to hide any 0 values, reducing clutter on the worksheet
Before/After - Only available for dates. Only show values before or after a certain date. For example, expiration date Before today. This will only show entries that have expired before today.
Blank - Hides any blank values. Entries will show up values are entered later, without having to update filters or make changes to the report.
Column Filters
Column filters work much the same way as Table Filters, and also have the same options. In text-based fields, you will be able to use the check marks to turn off and on specific values. You will also have the top section where you can define specific criteria for filtering.


An advantage of column filters is that you can also apply them to pivoted data. For example, you average your replicate values together. Table filters will still apply to the raw data, so the points that were averaged. However, you can use column filters to apply constraints to the new averaged values directly.
You can use both Table and Column Filters together. Based on your data type, there are nearly endless options for filtering.
Use Case:
This example will walk through combining Table and Column Filters together, resulting in a consolidated table, having just the exact information we are interested in.
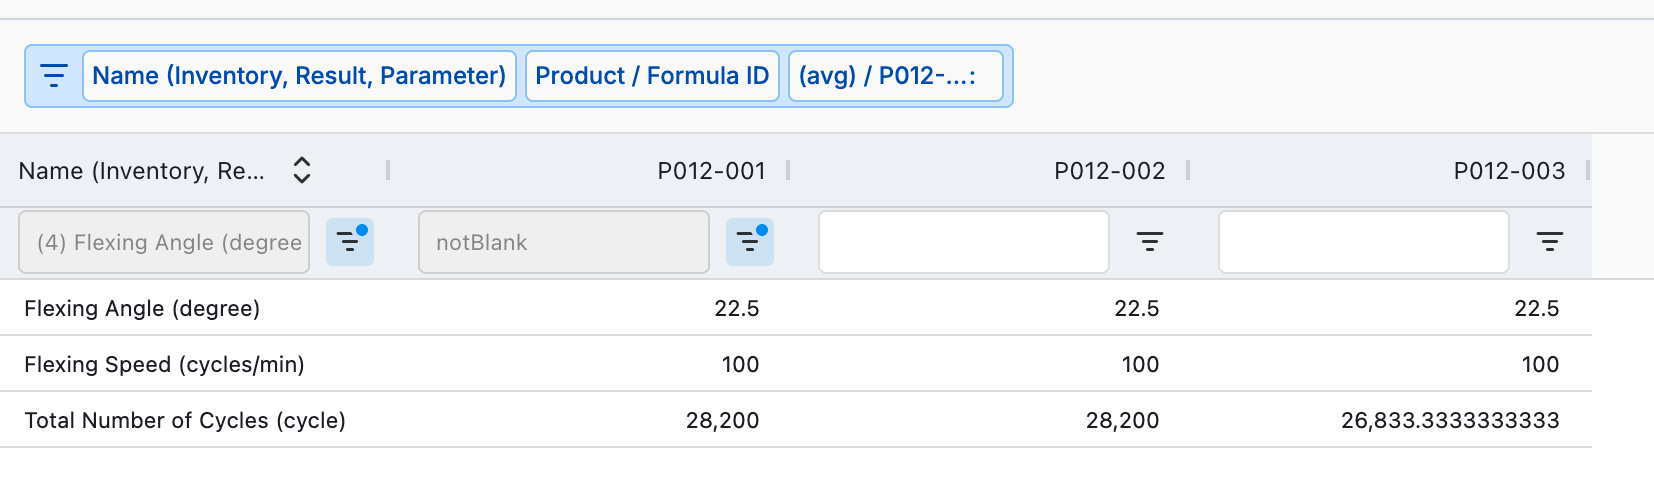
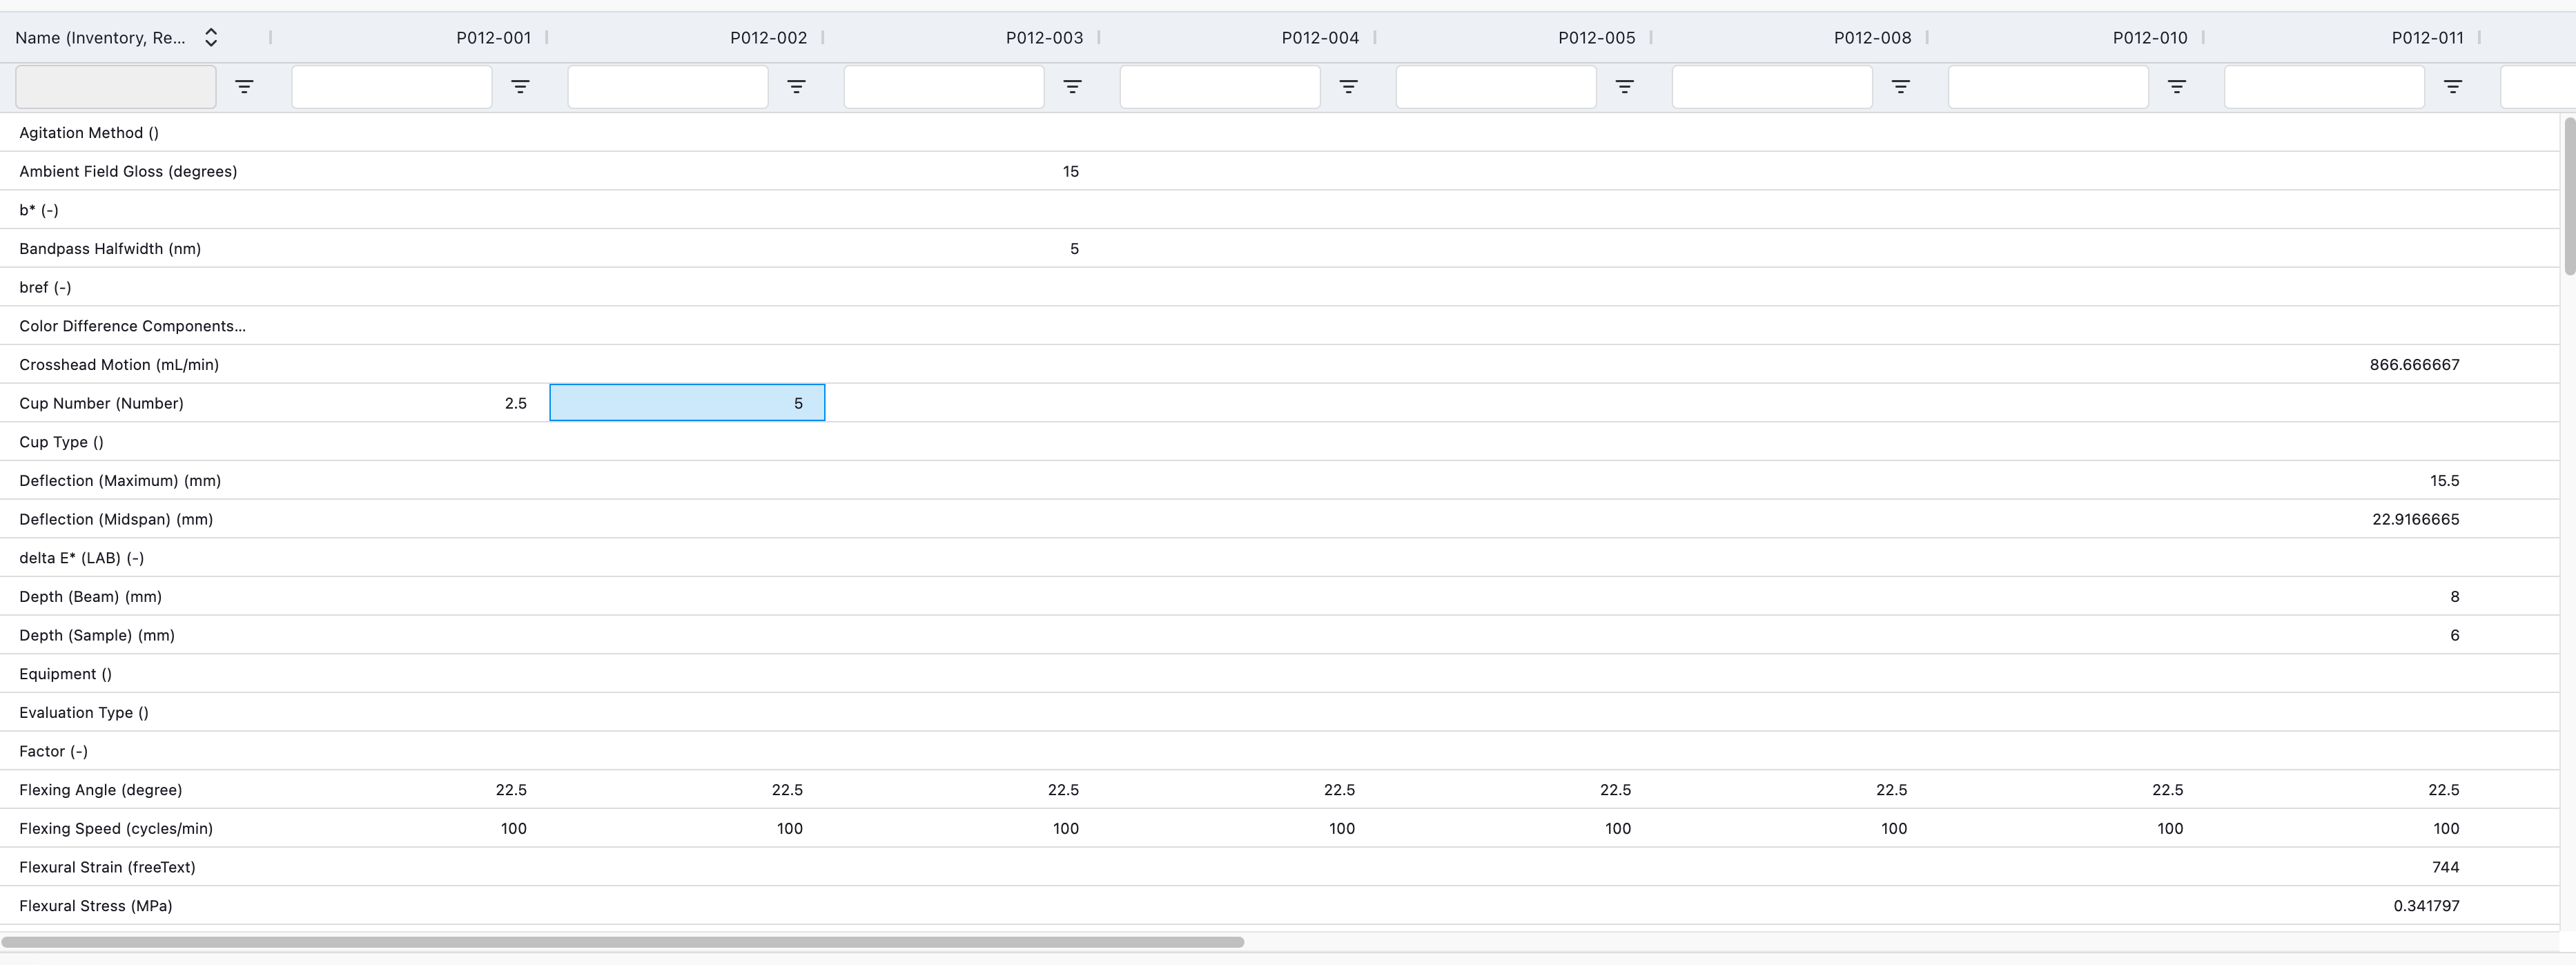
Below is a picture of my starting table. Formulas are the columns, and data columns (results) are rows.
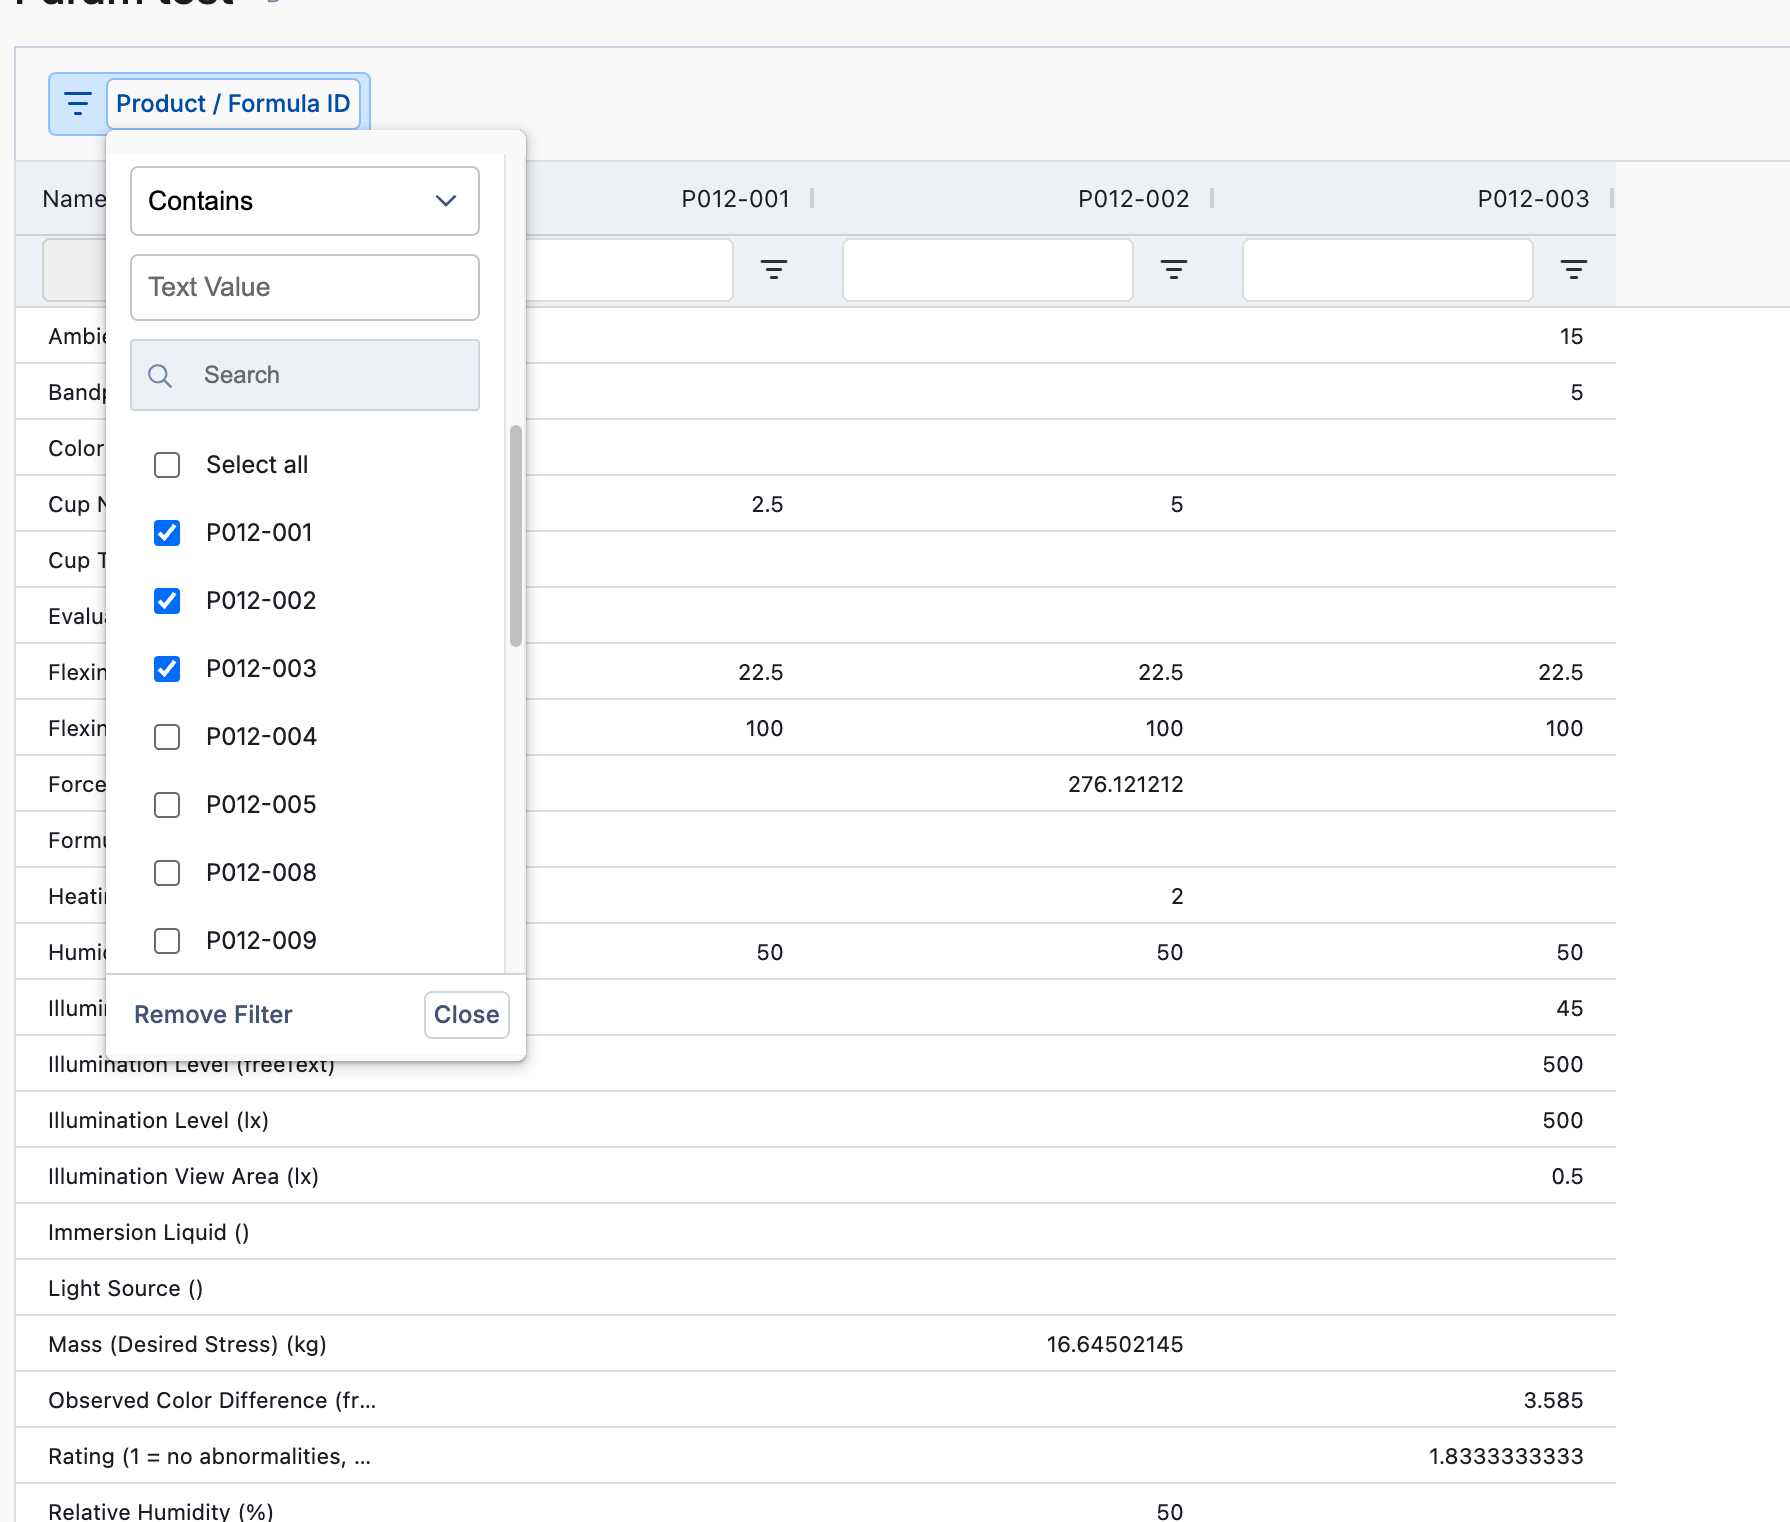
In this example, we are only interested in three formulations: P012-001, P012-002, and P012-0003. We can apply a Table Filter to remove the formula columns that we are not interested in.
Also, we are only interested in some of our results. In this case, we only want Flexing Angle, Flexing Speed, Observed Color Difference, and Total number of Cycles. We can apply another Table Filter to remove the other result types, as they are not of current interest to us.
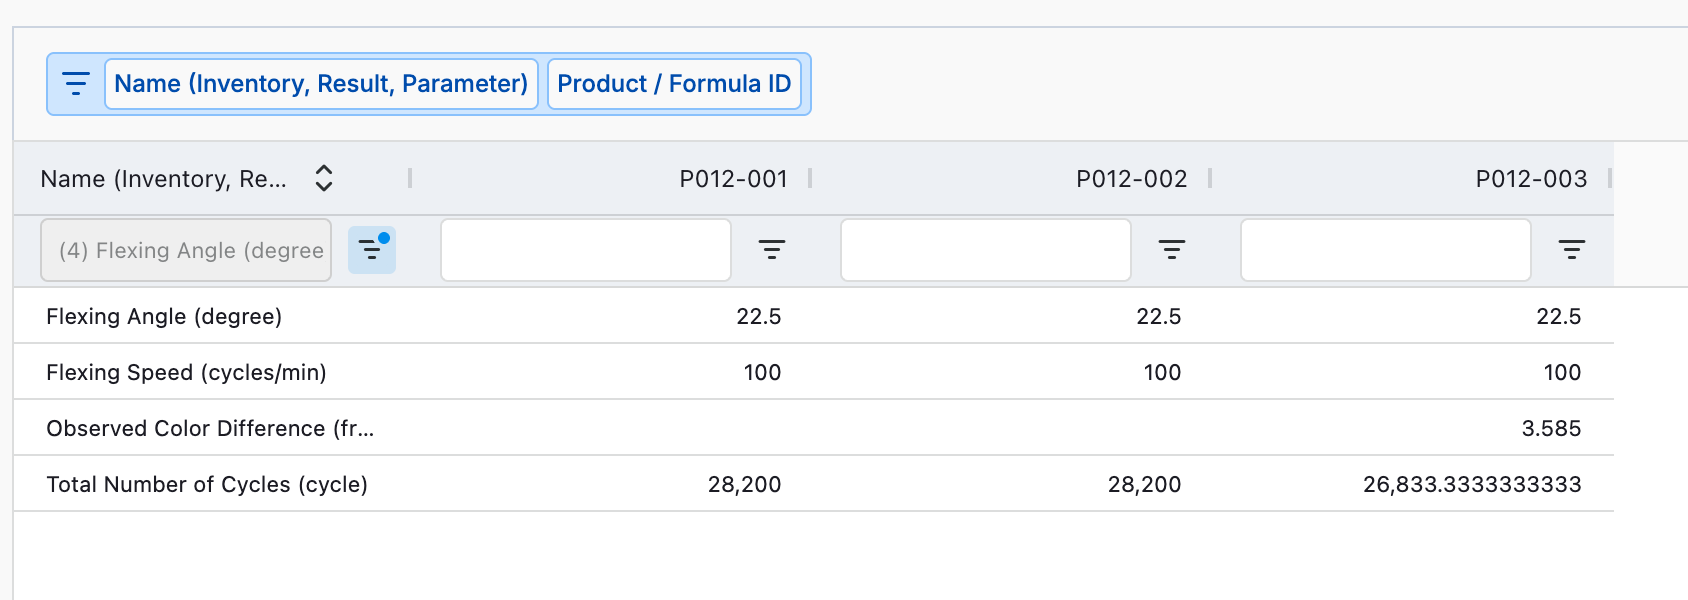
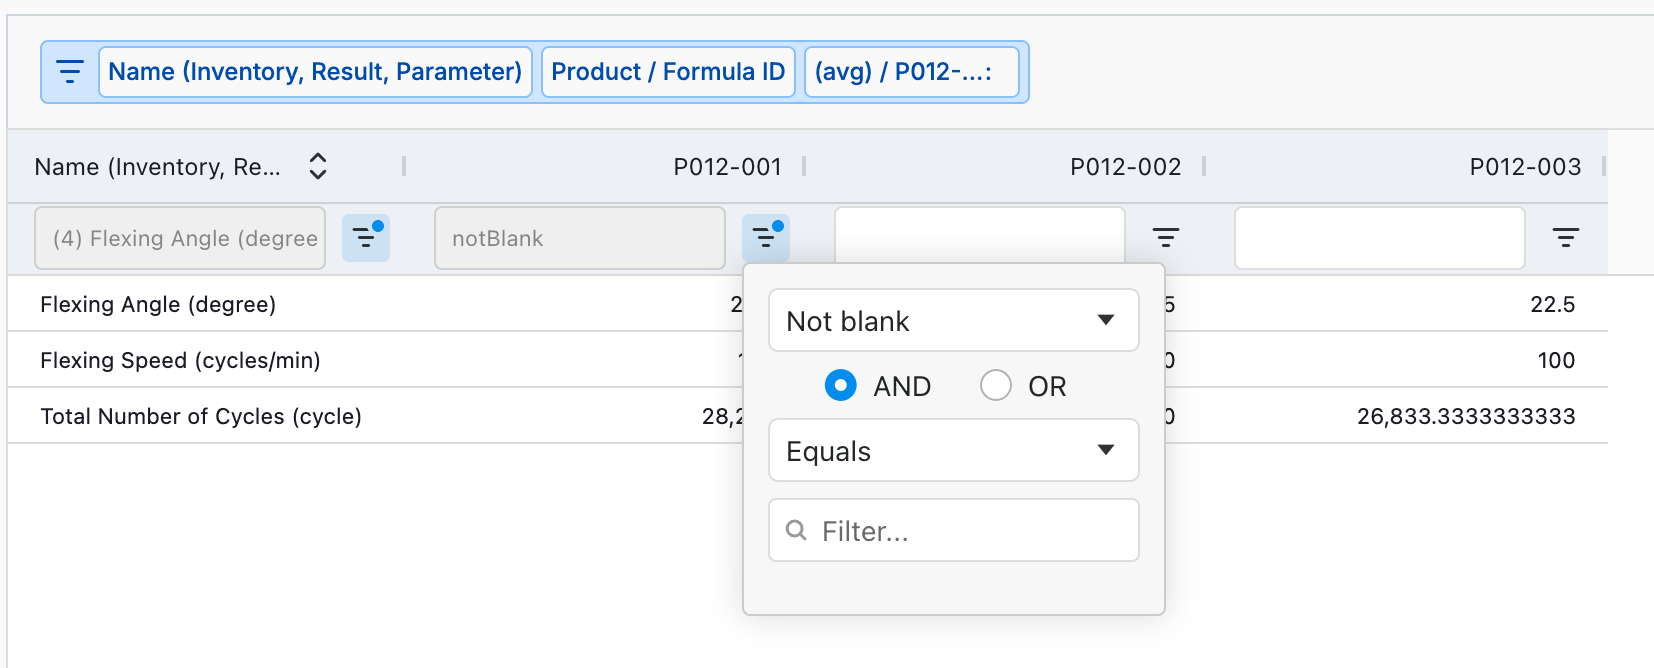
Now we can see that only 1 formula has Observed Color difference values. By adding a Not Blank column filter to formula P012-001, we can hide that row as we can not yet compare those values. However, if we collect that data later, the row will be unhidden and added to any chart we create later.